USD: Dec '24 is Down at 101.625.

Energies: Nov '24 Crude is Up at 74.79.

Financials: The Dec '24 30 Year T-Bond is Down 3 ticks and trading at 123.11

Indices: The Dec '24 S&P 500 emini ES contract is 56 ticks Higher and trading at 5763.00.

Gold: The Dec'24 Gold contract is trading Down at 2678.00.

Initial conclusion

This is not a correlated market.  The USD is Down and Crude is Up which is normal, and the 30 Year T-Bond is trading Lower.  The Financials should always correlate with the US dollar such that if the dollar is Higher, then the bonds should follow and vice-versa. The S&P is Higher and Crude is trading Higher which is not correlated. Gold is trading Lower which is not correlated with the US dollar trading Down.  I tend to believe that Gold has an inverse relationship with the US Dollar as when the US Dollar is down, Gold tends to rise in value and vice-versa. Think of it as a seesaw, when one is up the other should be down. I point this out to you to make you aware that when we don't have a correlated market, it means something is wrong. As traders you need to be aware of this and proceed with your eyes wide open. Asia traded mainly Higher with the exception of the Sensex exchange.  Europe is trading Higher with the exception of the London exchange. 

Possible challenges to traders

  • Average Hourly Earnings m/m is out at 8:30 AM EST.  This is Major.

  • Non-Farm Employment Change is out at 8:30 AM EST.  This is Major.

  • Unemployment Rate is out at 8:30 AM EST.  This is Major. 

  • FOMC Member Williams Speaks at 9 AM EST.  This is Major.

Traders, please note that we've changed the Bond instrument from the 10 year (ZN) to the 2 year (ZT).  They work exactly the same.  

We've elected to switch gears a bit and show correlation between the 2-year Treasury notes (ZT) and the S&P futures contract.  The YM contract is the Dow Jones Industrial Average, and the purpose is to show reverse correlation between the two instruments.  Remember it's likened to a seesaw, when up goes up the other should go down and vice versa.

Yesterday the ZT migrated Higher at around 8:30 AM EST with no real economic news in sight and began its Downward slide.  Look at the charts below and you'll see a pattern for both assets. The Dow moved Higher at 8:30 AM and the ZT moved Lower at around the same time.  These charts represent the newest version of Bar Charts, and I've changed the timeframe to a 15-minute chart to display better.  This represented a Short opportunity on the 2-year note, as a trader you could have netted about 20 ticks per contract on this trade.   Each tick is worth $7.625.  Please note: the front month for ZT is Dec and the Dow is now Dec '24.  I've changed the format to filled Candlesticks (not hollow) such that it may be more apparent and visible.

Charts courtesy of Barcharts

Chart

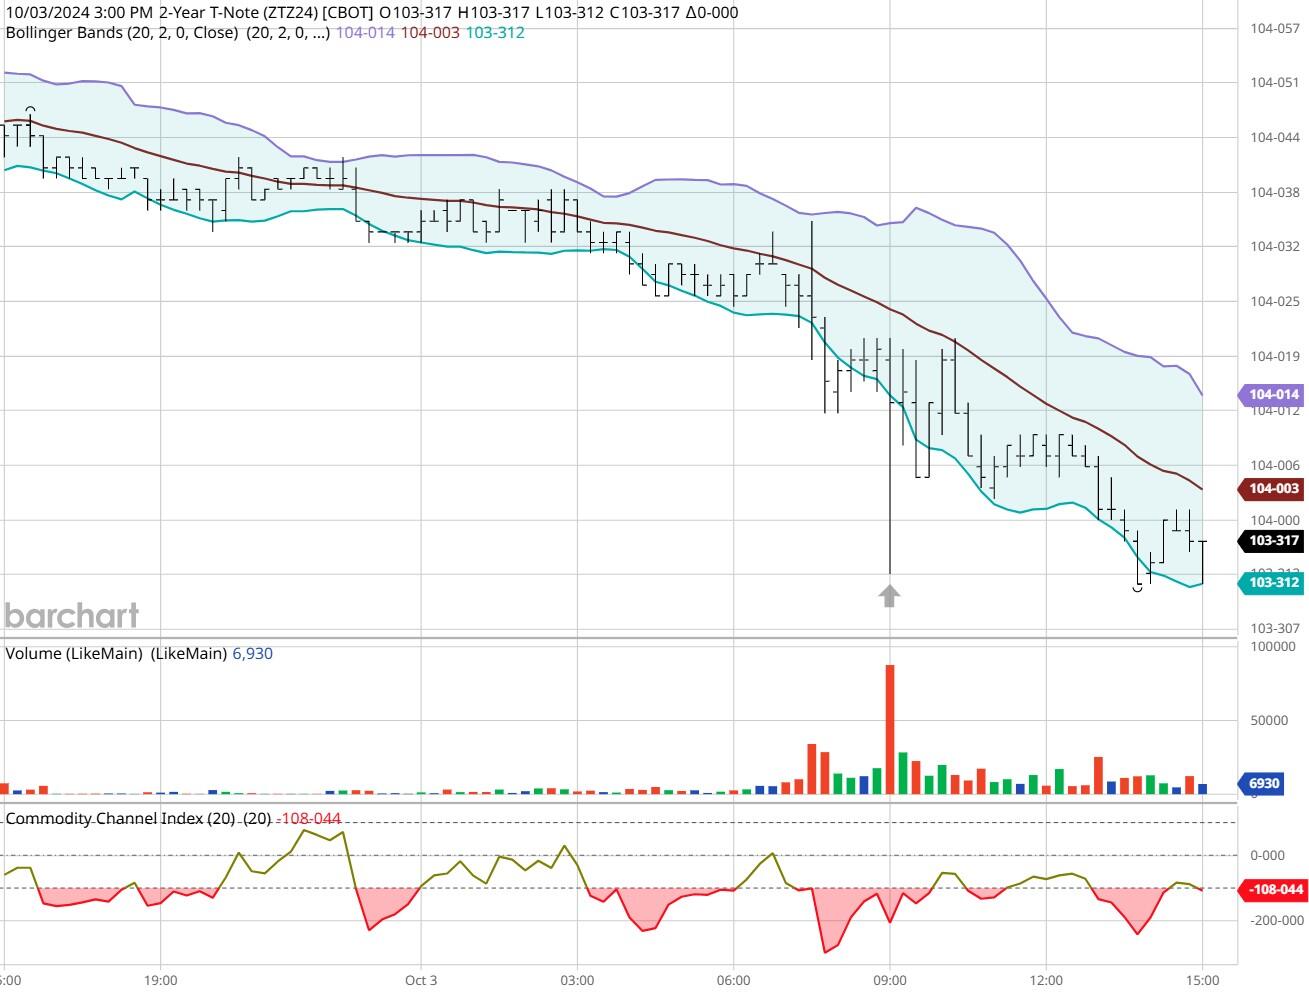
ZT -Dec 2024 - 10/03/24

Chart

Dow - Dec 2024- 10/03/24

Bias

Yesterday we gave the markets a Neutral or Mixed bias and the markets veered to the Downside.  The Dow dropped 185 points, and the other indices lost ground as well.  Given that today is Jobs Friday we will maintain a Neutral or Mixed bias.

Could this change? Of Course.  Remember anything can happen in a volatile market.

Commentary

Another Jobs Friday comes our way, but this one is especially critical as it is the last one prior to the November presidential election.  The markets veered to the downside yesterday as it is assumed that the Israeli Defense Force will attack Iran's oil supply sending prices much Higher.  All this being said we will maintain a Neutral bias today as it is Jobs Friday and the markets have never shown any sense of normalcy on that day. 

Trading performance displayed herein is hypothetical. The following Commodity Futures Trading Commission (CFTC) disclaimer should be noted.

Hypothetical performance results have many inherent limitations, some of which are described below. No representation is being made that any account will or is likely to achieve profits or losses similar to those shown.

In fact, there are frequently sharp differences between hypothetical performance results and the actual results subsequently achieved by any particular trading program. One of the limitations of hypothetical performance trading results is that they are generally prepared with the benefit of hindsight.

In addition, hypothetical trading does not involve financial risk, and no hypothetical trading record can completely account for the impact of financial risk in actual trading. For example, the ability to withstand losses or to adhere to a particular trading program in spite of trading losses are material points which can also adversely affect actual trading results.

There are numerous other factors related to the markets in general or to the implementation of any specific trading program which cannot be fully accounted for in the preparation of hypothetical performance results and all of which can adversely affect actual trading results.

Trading in the commodities markets involves substantial risk and YOU CAN LOSE A LOT OF MONEY, and thus is not appropriate for everyone. You should carefully consider your financial condition before trading in these markets, and only risk capital should be used.

In addition, these markets are often liquid, making it difficult to execute orders at desired prices. Also, during periods of extreme volatility, trading in these markets may be halted due to so-called “circuit breakers” put in place by the CME to alleviate such volatility. In the event of a trading halt, it may be difficult or impossible to exit a losing position.

Recommended Content


Recommended Content

Editors’ Picks

EUR/USD breaks below 1.1000 on stellar NFP

EUR/USD breaks below 1.1000 on stellar NFP

The buying bias in the Greenback gathers extra pace on Friday after the US economy created far more jobs than initially estimated in September, dragging EUR/USD to the area of new lows near 1.0950.

EUR/USD News
GBP/USD breaches 1.3100 after encouraging US Payrolls

GBP/USD breaches 1.3100 after encouraging US Payrolls

The continuation of the uptrend in the US Dollar motivates GBP/USD to accelerates its losses and breaches 1.3100 the figure in the wake of the release of US NFP.

GBP/USD News
Gold tests fresh lows near $2,640 after strong NFP

Gold tests fresh lows near $2,640 after strong NFP

Gold prices intensifies their bearish stance for the day, deflating to the vicinity of the $2,640 region following the publication of the US labour market report for the month of September.

Gold News
US Payrolls surge in September, as 50bp rate cut ruled out

US Payrolls surge in September, as 50bp rate cut ruled out

US payrolls data surprised on the upside in September, rising by 254k, smashing expectations of a 150k rise. The unemployment rate fell to 4.1% from 4.2%, average hourly earnings increased to a 4% YoY rate and there was a 72k upwards revision to the previous two months’ payrolls numbers.

Read more
RBA widely expected to keep key interest rate unchanged amid persisting price pressures

RBA widely expected to keep key interest rate unchanged amid persisting price pressures

The Reserve Bank of Australia is likely to continue bucking the trend adopted by major central banks of the dovish policy pivot, opting to maintain the policy for the seventh consecutive meeting on Tuesday.

Read more
Five best Forex brokers in 2024

Five best Forex brokers in 2024

VERIFIED Choosing the best Forex broker in 2024 requires careful consideration of certain essential factors. With the wide array of options available, it is crucial to find a broker that aligns with your trading style, experience level, and financial goals. 

Read More

Majors

Cryptocurrencies

Signatures