Jobs down, so was the markets

USD: Sept '24 is Down at 102.440.
Energies: Sept '24 Crude is Down at 71.90.
Financials: The Sept '24 30 Year T-Bond is Up 24 ticks and trading at 125.26
Indices: The Sept '24 S&P 500 emini ES contract is 732 ticks Lower and trading at 5195.00.
Gold: The Aug'24 Gold contract is trading Down at 2426.20
Initial conclusion
This is not a correlated market. The USD is Down and Crude is Down which is not normal, and the 30 Year T-Bond is trading Up. The Financials should always correlate with the US dollar such that if the dollar is Higher, then the bonds should follow and vice-versa. The S&P is Lower and Crude is trading Lower which is not correlated. Gold is trading Lower which is not correlated with the US dollar trading Down. I tend to believe that Gold has an inverse relationship with the US Dollar as when the US Dollar is down, Gold tends to rise in value and vice-versa. Think of it as a seesaw, when one is up the other should be down. I point this out to you to make you aware that when we don't have a correlated market, it means something is wrong. As traders you need to be aware of this and proceed with your eyes wide open. Currently all of Asia is trading Lower. All of Europe is trading Lower as well.
Possible challenges to traders
-
Final Services PMI is out at 9:45 AM EST. This is Major.
-
ISM Services PMI is out at 10 AM EST. This is Major.
-
Loan Officer Survey is out at 2 PM EST. This is Major.
-
FOMC Member Daly Speaks out at 5 PM EST. This is not Major as it is after hours.
Traders, please note that we've changed the Bond instrument from the 10 year (ZN) to the 2 year (ZT). They work exactly the same.
We've elected to switch gears a bit and show correlation between the 10-year Treasury notes (ZN) and the S&P futures contract. The YM contract is the Dow Jones Industrial Average, and the purpose is to show reverse correlation between the two instruments. Remember it's likened to a seesaw, when up goes up the other should go down and vice versa.
On Friday the ZT migrated Higher at around 8:30 AM EST. If you look at the charts below the ZT gave a signal at around 8:30 AM after the Jobs Report was released and started its Upward climb. Look at the charts below and you'll see a pattern for both assets. The Dow moved Lower at 8:30 AM and the ZT moved Higher at around the same time. These charts represent the newest version of BarCharts, and I've changed the timeframe to a 15-minute chart to display better. This represented a Long opportunity on the 2-year note, as a trader you could have netted about 40 plus ticks per contract on this trade. Each tick is worth $7.625. Please note: the front month for ZT is Sept and the Dow is now Sept '24. I've changed the format to filled Candlesticks (not hollow) such that it may be more apparent and visible.
Charts courtesy of Barcharts
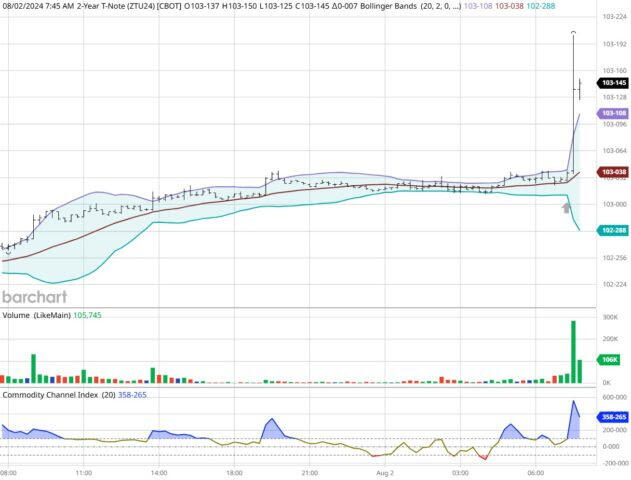
ZT -Sept 2024 - 08/02/24
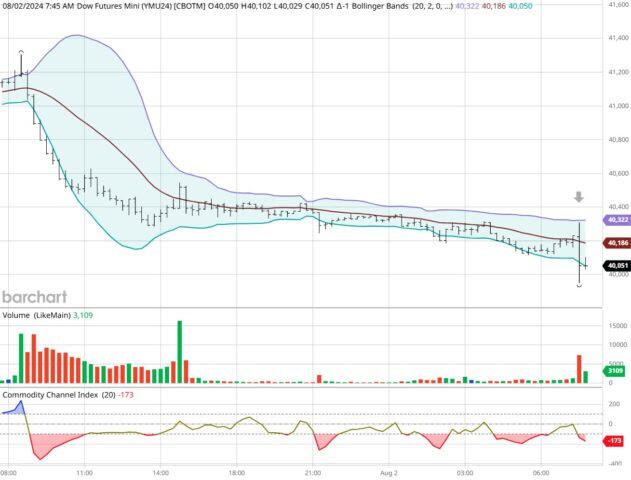
Dow - Sept 2024 - 08/02/24
Bias
On Friday we gave the markets a Neutral or Mixed bias as it was Jobs Friday, and we always maintain a Neutral or Mixed bias on that day. The Dow dropped 611 points, the S&P lost 100 and the Nasdaq 418. Today we aren't dealing with a correlated market and our bias is to the Downside.
Could this change? Of Course. Remember anything can happen in a volatile market.
Commentary
Well Jobs Friday came and went and unfortunately it wasn't a very good report in that it didn't meet expectation. The markets expected a gain of 176,000 net new jobs created in July and it got 114,000. The unemployment rate rose to 4.3% up from 4.1% prior. The Democrats shouldn't expound upon the benefits and virtues of "Bidenomics" as interest rates are still high and until the time comes that the Federal Reserve starts to Lower no one will feel the benefits of "Bidenomics." As I've stated previously unless people are feeling it, it doesn't exist for them and never will. The Real Estate market alone could be booming right now given the time of year that it is and with more capital freely available home improvement projects could become a reality. Today we have Final Services and ISM Services, and we hope this can alleviate the down trend we are seeing.
Author

Nick Mastrandrea
Market Tea Leaves


