USD: Jun '25 is Down at 102.645  

Energies: May '25 Crude is Down at 59.59.

Financials: The Jun '25 30 Year T-Bond is Higher by 1 tick and trading at 120.20.

Indices: The Jun '25 S&P 500 emini ES contract is 588 ticks Lower and trading at 4969.00

Gold: The Jun'25 Gold contract is trading Up at 3046.80

Initial conclusion

This is not a correlated market.  The USD is Down and Crude is Down which is not normal, but the 30 Year T-Bond is trading Higher.  The Financials should always correlate with the US dollar such that if the dollar is Higher, then the bonds should follow and vice-versa. The S&P is Lower and Crude is trading Lower which is not correlated. Gold is trading Higher which is correlated with the US dollar trading Down.  I tend to believe that Gold has an inverse relationship with the US Dollar as when the US Dollar is down, Gold tends to rise in value and vice-versa. Think of it as a seesaw, when one is up the other should be down. I point this out to you to make you aware that when we don't have a correlated market, it means something is wrong. As traders you need to be aware of this and proceed with your eyes wide open. All of Asia traded Lower.  All of Europe is trading Lower as well.

Possible challenges to traders

  • FOMC Member Kugler Speaks at 10:30 AM EST.  This is Major.

  • Consumer Credit is out at 3 PM EST.  This is Major.

Traders, please note that we've changed the Bond instrument from the 10 Year (ZN) to the 2 Year (ZT).  They work exactly the same.

We've elected to switch gears a bit and show correlation between the 2-year Treasury notes (ZT) and the S&P futures contract.  The YM contract is the Dow Jones Industrial Average, and the purpose is to show reverse correlation between the two instruments.  Remember it's likened to a seesaw, when up goes up the other should go down and vice versa.

On Friday the ZT dived Lower at around 8:30 AM EST with Non-Farm Payrolls waiting for release.  The Dow moved Higher at the same time.  Look at the charts below and you'll see a pattern for both assets. The Dow moved Higher at 8:30 AM EST and the ZT moved Lower at around the same time.  These charts represent the newest version of Bar Charts, and I've changed the timeframe to a 15-minute chart to display better.  This represented a Short opportunity on the 2-year note, as a trader you could have netted about 30 plus ticks per contract on this trade.   Each tick is worth $6.25.  Please note: the front month for ZT is now Jun '25 and the Dow is Jun '25 as well.  I've changed the format to filled Candlesticks (not hollow) such that it may be more apparent and visible.

Charts courtesy of BarCharts

Chart

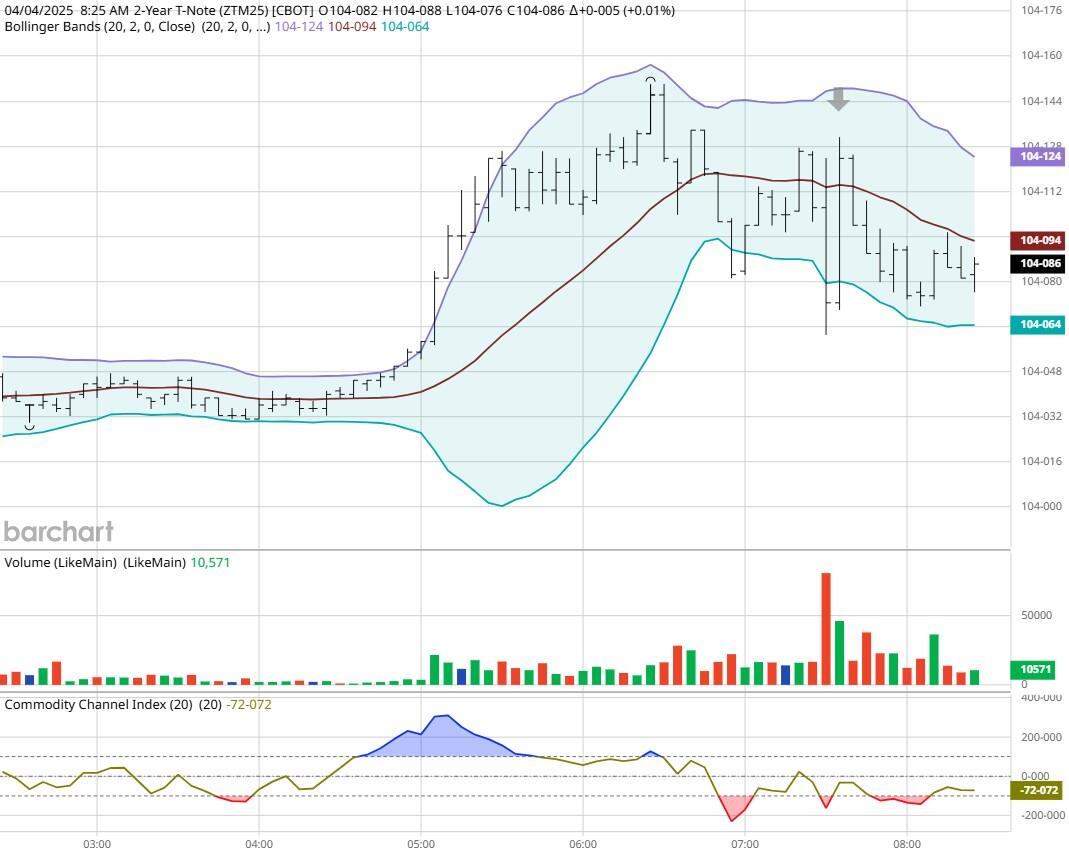
ZT -Jun 2025 - 4/04/25

Chart

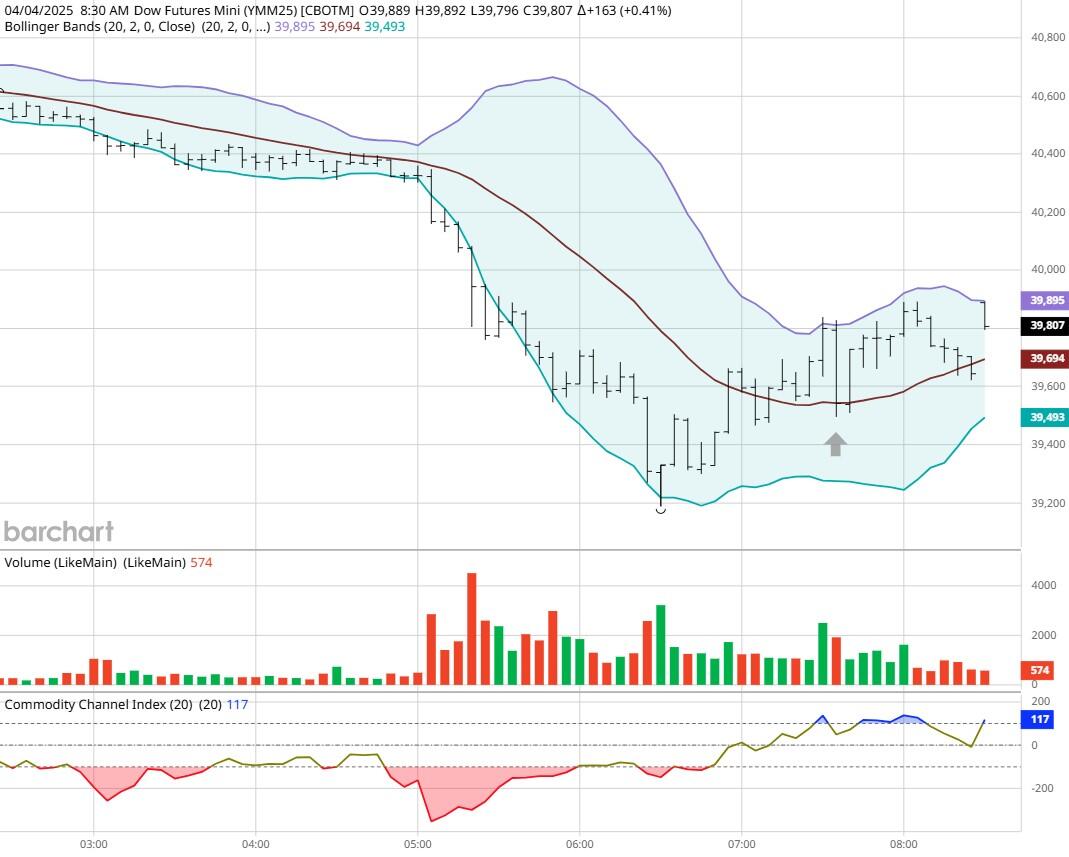
Dow - Mar 2025- 4/04/25

Bias

On Friday we gave the markets a Neutral or Mixed bias.  The markets traded Lower after Trump doubled downs on tariffs.  The Dow was Lower from the opening bell and never saw positive territory.  It closed 2,232 points Lower, and the other indices closed Lower as well.  Given all the dialogue regarding the Tariffs, our bias is to the Downside.

Could this change? Of Course.  Remember anything can happen in a volatile market.

Commentary

So Friday we received a bit of a surprise in that the Job numbers came in better than expected.  The US economy created 228,000 jobs versus the 137,000 expected.  At the end of the day it didn't matter as the Dow closed over 2,200 points Lower and the other indices collapsed.    Want to learn Market Correlation and determine market direction hours before the Opening Bell?

Trading performance displayed herein is hypothetical. The following Commodity Futures Trading Commission (CFTC) disclaimer should be noted.

Hypothetical performance results have many inherent limitations, some of which are described below. No representation is being made that any account will or is likely to achieve profits or losses similar to those shown.

In fact, there are frequently sharp differences between hypothetical performance results and the actual results subsequently achieved by any particular trading program. One of the limitations of hypothetical performance trading results is that they are generally prepared with the benefit of hindsight.

In addition, hypothetical trading does not involve financial risk, and no hypothetical trading record can completely account for the impact of financial risk in actual trading. For example, the ability to withstand losses or to adhere to a particular trading program in spite of trading losses are material points which can also adversely affect actual trading results.

There are numerous other factors related to the markets in general or to the implementation of any specific trading program which cannot be fully accounted for in the preparation of hypothetical performance results and all of which can adversely affect actual trading results.

Trading in the commodities markets involves substantial risk and YOU CAN LOSE A LOT OF MONEY, and thus is not appropriate for everyone. You should carefully consider your financial condition before trading in these markets, and only risk capital should be used.

In addition, these markets are often liquid, making it difficult to execute orders at desired prices. Also, during periods of extreme volatility, trading in these markets may be halted due to so-called “circuit breakers” put in place by the CME to alleviate such volatility. In the event of a trading halt, it may be difficult or impossible to exit a losing position.

Recommended Content


Recommended Content

Editors’ Picks

Gold hovers around all-time highs near $3,250

Gold hovers around all-time highs near $3,250


Gold is holding steady near the $3,250 mark, fuelled by robust safe-haven demand, trade war concerns, and a softer-than-expected US inflation gauge. The US Dollar keeps trading with heavy losses around three-year lows.

Gold News
EUR/USD retreats towards 1.1300 as Wall Street shrugs off trade war headlines

EUR/USD retreats towards 1.1300 as Wall Street shrugs off trade war headlines

The EUR/USD pair retreated further from its recent multi-month peak at 1.1473 and trades around the 1.1300 mark. Wall Street manages to advance ahead of the weekly close, despite escalating tensions between Washington and Beijing and mounting fears of a US recession. Profit-taking ahead of the close also weighs on the pair. 

EUR/USD News
GBP/USD trims gains, recedes to the 1.3050 zone

GBP/USD trims gains, recedes to the 1.3050 zone

GBP/USD now gives away part of the earlier advance to fresh highs near 1.3150. Meanwhile, the US Dollar remains offered amid escalating China-US trade tensions, recession fears in the US, and softer-than-expected US Producer Price data.

GBP/USD News
Bitcoin, Ethereum, Dogecoin and Cardano stabilze –  Why crypto is in limbo

Bitcoin, Ethereum, Dogecoin and Cardano stabilze –  Why crypto is in limbo

Bitcoin, Ethereum, Dogecoin and Cardano stabilize on Friday as crypto market capitalization steadies around $2.69 trillion. Crypto traders are recovering from the swing in token prices and the Monday bloodbath. 

Read more
Is a recession looming?

Is a recession looming?

Wall Street skyrockets after Trump announces tariff delay. But gains remain limited as Trade War with China continues. Recession odds have eased, but investors remain fearful. The worst may not be over, deeper market wounds still possible.

Read more
The Best brokers to trade EUR/USD

The Best brokers to trade EUR/USD

SPONSORED Discover the top brokers for trading EUR/USD in 2025. Our list features brokers with competitive spreads, fast execution, and powerful platforms. Whether you're a beginner or an expert, find the right partner to navigate the dynamic Forex market.

Read More

Majors

Cryptocurrencies

Signatures

Best Brokers of 2025