|

It‘s too early to say that Oil is range-bound here

Semiconductors and tech sent S&P 500 sharply down – chips and China in focus, with ASML earnings failing to convince. Russell 2000 and other pockets of strength managed to move sideways as price spikes were rejected here too. Positive housing data and roughly a per latest expectations 20y Treasury auction failed to provide a relief rally into the close that would stick. Even mighty gold (my oasis within select sectoral picks shared with clients) suffered an intraday setback.

Best to have a look at this S&P 500 market breadth chart.

Chart

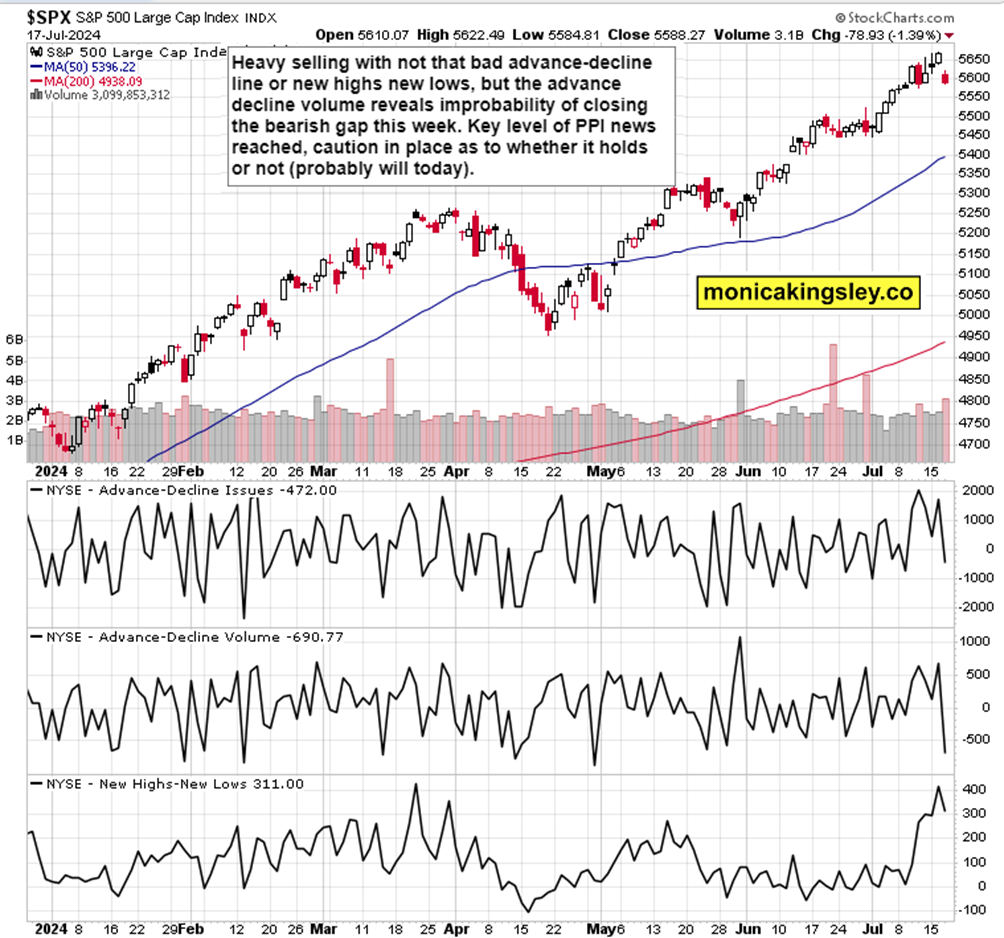
Precarious position where S&P 500 is sitting at a strong support (corresponding to $557 SPY with QQQ leading to the downside (well below analogical support), and XLC understandably joining too. Time to be wary, because if the support breaks, there is quite some quick room to the downside.

Let‘s mve right into the charts – today‘s full scale article contains 3 more of them, with commentaries.

Tired of seeing those red boxes instead of way more valuable information? Try the premium services based on what and how you trade.

Crude Oil

Chart

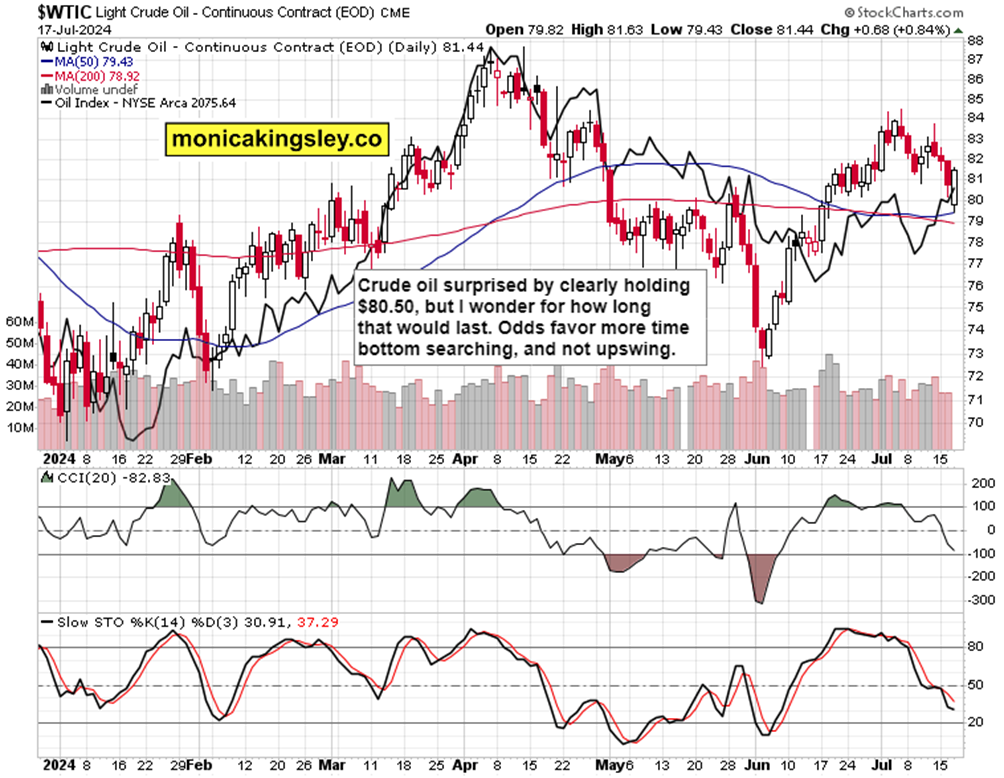
It‘s too early to say that oil is range-bound here – I favor at least one more push lower challenging yesterday‘s lows. Given though the US uncertainty, I would favor such a distinct move to happen only next week – slow push to the downside (to $80.50 but not too below) is more appropriate for the current one.

Author

Monica Kingsley

Monica Kingsley

Monicakingsley

Monica Kingsley is a trader and financial analyst serving countless investors and traders since Feb 2020.

More from Monica Kingsley
Share:

Editor's Picks

EUR/USD consolidates around 1.0900, bullish bias remains ahead of key US data

The EUR/USD pair is seen consolidating its strong gains registered over the past two days and oscillating in a narrow band during the Asian session on Tuesday. Spot prices currently trade around the 1.1900 mark, just below an over one-week high touched the previous day.

GBP/USD tilts bullish as markets barrel toward mid-week NFP print

GBP/USD is holding a broader bullish structure on the daily chart, with price trading well above the 50 Exponential Moving Average at 1.3507 and the 200 EMA at 1.3310, confirming the intermediate uptrend that has been in place since the November 2025 low near 1.2300. 

Gold retreats below $5,050 on profit-taking ahead of US data

Gold price attracts some sellers in the Asian session on Tuesday, falling back below $5.050. The precious metal edges lower amid improved risk sentiment and some profit-taking. Traders look to the US Retail Sales data and Fedspeak due later in the day ahead of Wednesday's Nonfarm Payrolls release.  

Litecoin eyes $50 as heavy losses weigh on investors

Following a strong downtrend across the crypto market over the past week, Litecoin holders are under immense pressure. The Bitcoin fork has trimmed about $1.81 billion from its market capitalization since the beginning of the year, sending it below the top 20 cryptos by market cap.

The market is buying everything again but is it dancing on a borrowed floor

The market has a short memory and a fast trigger finger. Last week’s liquidation barely cooled before risk came roaring back, pushing the S&P toward record territory and reinstalling Big Tech as the engine of choice. This is not discovery. It is re exposure.

Ripple exposed to volatility amid low retail interest, modest fund inflows

Ripple (XRP) is extending its intraday decline to around $1.40 at the time of writing on Monday amid growing pressure from the retail market and risk-off sentiment that continues to keep investors on the sidelines.