Is There Too Much Debt in the Eurozone?: Part II

Financial Positions of Households Have Improved
Executive Summary
In the second report in our series on debt in the Eurozone, we focus on the household sector. In general, the financial position of the household sector has improved over the past decade. The household debt-to-GDP ratio has receded in most economies, and net worth has risen markedly. Furthermore, extraordinarily low interest rates have pushed the household debt-servicing ratio to its lowest level since the Eurozone came into existence twenty years ago. In our view, the household sector will probably not be the epicenter of the next financial crisis in the euro area, at least not in the foreseeable future.
The Household Sector Has De-levered Modestly Over the Past Decade
As we wrote in a recent report, the total amount of debt in the Eurozone has risen roughly €10 trillion over the past ten years. However, the economy has grown on balance over that period, so the overall debt-to-GDP ratio, which is a measure of leverage, has actually receded somewhat from the peak that it reached a few years ago. But as we noted in our first report, some observers fret that the Eurozone could potentially slip into recession in the near term. In that event, concerns could start to mount again about an unsustainable build-up in debt in certain sectors and countries. In this report, which is our second installment in a series of reports on debt in the euro area, we analyze the household sector to determine whether it could be the potential catalyst for a debt crisis in the foreseeable future.
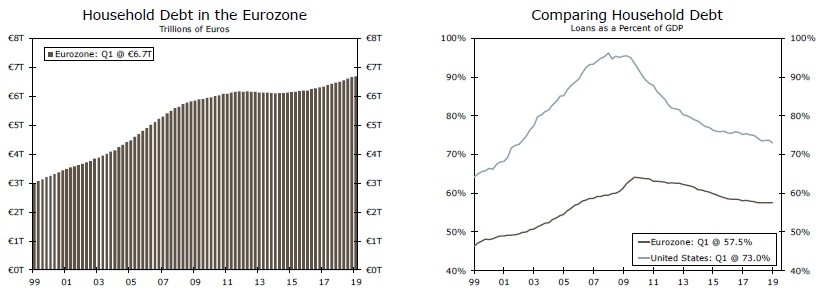
Let's start with the basics. Household debt in the Eurozone doubled to €6 trillion in 2012 from €3 trillion at the advent of the European Monetary Union in 1999 (Figure 1). After staying essentially unchanged for a few years, the amount of household debt outstanding is rising again and currently stands at €6.7 trillion. But measured as a percent of GDP, household debt in the euro area has declined steadily from its peak of 64% in 2009 (Figure 2). Today's ratio of 58% is well below the comparable ratio of 73% at present in the United States.
The aggregate household-debt-to-GDP ratio in the euro area is down about seven percentage points over the past ten years, but there have been some sizeable declines in individual countries (Figure 3). For example, the ratio has receded 25 percentage points or more in Ireland, Latvia and Spain, which are economies that experienced housing bubbles in the years leading up to the global financial crisis.1 However, some countries, especially the Netherlands and Cyprus, still have outsized household debt-to-GDP ratios relative to the Eurozone aggregate of 58% (Figure 4). But an economy could still face a household debt problem even though it may have a relatively low debtto- GDP ratio if households have weak balance sheets and/or they have difficulties servicing their debts. A deeper dive into household debt in the euro area is therefore warranted.

Debt & Debt-Servicing Have Receded in Most Countries
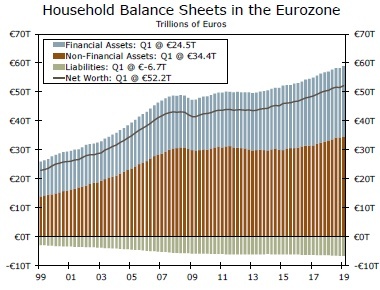
Because debt represents only one facet of a household's financial position, a thorough analysis should also take account of the asset side of the balance sheet. In that regard, the value of household assets in the overall euro area has risen €11 trillion since the depths of the Great Recession (Figure 5). Most of this increase reflects the rising value of financial assets, although the value of nonfinancial assets (largely residential real estate) has risen more than €4 trillion over that period. With household liabilities up less than €1 trillion, net worth has climbed by more than €10 trillion over the past ten years. In short, the financial position of the household sector appears to be in much better shape today than it was a decade ago, at least on an aggregate Eurozone basis.
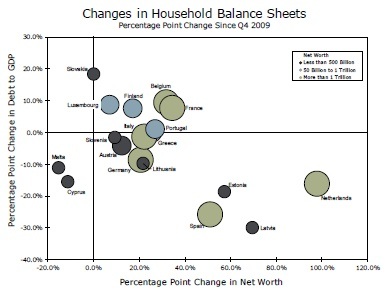
But are there any individual economies in which balance sheets remain weak? Figure 6 plots changes over the last ten years in household debt-to-GDP ratios and changes during that period in household financial net worth-to-GDP ratios for each of the 19 individual economies in the euro area.2, 3 The southeast quadrant of the chart is the "best" because economies that fall into that quadrant have experienced both a drop in their household-debt-to-GDP ratio and a rise in their household financial net worth-to-GDP ratio over the past decade. On the other hand, the northwest quadrant is potentially problematic because economies that fall therein have experienced both rising household leverage and falling household financial wealth. Most of the largest economies in the Eurozone (denoted by the largest circles) fall into the southeast quadrant (i.e., the "best" quadrant). Only Slovakia, which is one of the smaller economies in the euro area, is close to the northwest quadrant. In short, there do not appear to be any major economies in the Eurozone that have suffered a significant deterioration in household balance sheets over the past ten years.
Turning to the debt-servicing ability of the households sector, the amount of income that households devote to servicing debt, which includes interest and amortization payments, has dropped to only 7.3% today from a peak of 9.4% in 2008 (Figure 7).4 Not only have households delevered somewhat in the past ten years (Figure 2), but monetary easing by the European Central Bank (ECB) has also pushed down debt-servicing costs for most consumers. As shown in Figure 8, most of the large economies in the Eurozone have household debt service ratios that are either at the average rate for the Eurozone or a bit below it. But the Netherlands stands out as a notable outlier with a debt service ratio in excess of 15%.
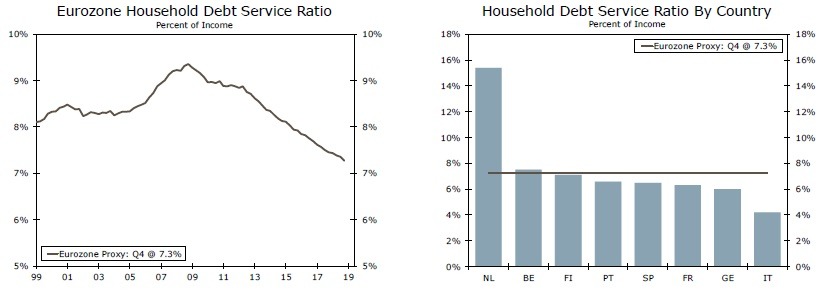
Should we worry about Dutch households? The household debt service ratio in the Netherlands may be elevated, but it stood at 19% as recently as 2012. Furthermore, Dutch households have experienced a marked increase in financial net worth over the past decade while the household debt-to-GDP ratio in the Netherlands has declined about 16 percentage points over that period (Figure 6). In other words, the financial health of the Dutch household sector is not as weak as it was a decade ago. The Netherlands is a relatively large economy—nominal GDP totaled about €770 billion last year—but it accounts for only 7% of total GDP in the euro area. In short, a household debt crisis in the Netherlands, should one occur, probably would not bring the entire Eurozone economy to its knees.
The bottom line is that household debt likely will not be a catalyst for a financial crisis in the Eurozone, at least not anytime soon. Yes, some households, especially those in the Netherlands, could experience debt-servicing difficulties if interest rates were to rise sharply and/or income growth were to nosedive. In that regard, the ECB likely will not be raising rates anytime soon. Indeed, we look for the ECB to cut rates further into negative territory at its September 12 policy meeting. Moreover, the income trends for households in the Eurozone appear to be reasonable at present. Employment growth has downshifted in recent quarters, but it is still exceeding 1% on a year-over-year basis. Household gross disposable income in the Eurozone in Q1-2019 (latest available data) stood 4% higher than it did a year ago, which is the strongest year-over-year growth rate in the post-crisis era.
Conclusion
The aggregate amount of household debt in the 19 economies that comprise the Eurozone has risen about €1 trillion over the past ten years. But GDP in the euro area has expanded on balance over that period, so the household debt-to-GDP ratio, which is a way to measure leverage, has receded since its high-water mark of 64% in 2010. Furthermore, household debt-to-GDP ratios have declined in most individuals countries, and extraordinarily low interest rates have pushed the household debt-servicing ratio to its lowest level since the Eurozone came into existence twenty years ago. In our view, the household sector will probably not be the epicenter of the next financial crisis in the euro area, at least not in the foreseeable future. But could a financial crisis in the Eurozone emanate from the financial sector or the non-financial business sector? What about government debt? Is there an excessive amount of government debt in the euro area? We will address these questions in forthcoming reports in this series.
Author

Wells Fargo Research Team
Wells Fargo


