Richmond Manufacturing and Existing Home Sales did not meet expectation

USD: Sept '24 is Down at 104.135.
Energies: Aug '24 Crude is Up at 77.71.
Financials: The Sept '24 30 Year T-Bond is Down 3 ticks and trading at 118.30
Indices: The Sept '24 S&P 500 emini ES contract is 164 ticks Lower and trading at 5558.00.
Gold: The Aug'24 Gold contract is trading Up at 2414.10
Initial Conclusion
This is not a correlated market. The USD is Down and Crude is Up which is normal, and the 30 Year T-Bond is trading Down. The Financials should always correlate with the US dollar such that if the dollar is Higher, then the bonds should follow and vice-versa. The S&P is Lower and Crude is trading Lower which is not correlated. Gold is trading Higher which is correlated with the US dollar trading Down. I tend to believe that Gold has an inverse relationship with the US Dollar as when the US Dollar is down, Gold tends to rise in value and vice-versa. Think of it as a seesaw, when one is up the other should be down. I point this out to you to make you aware that when we don't have a correlated market, it means something is wrong. As traders you need to be aware of this and proceed with your eyes wide open. All of Asia traded Lower. Currently all of Europe is trading Lower with the exception of the Spanish IBEX exchange which is fractionally Higher.
Possible challenges to traders
-
Goods Trade Balance is out at 8:30 AM EST. This is Major.
-
Prelim Wholesale Inventories m/m is out at 8:30 AM EST. This is Major.
-
Flash Manufacturing PMI is out at 9:45 AM EST. This is Major.
-
Flash Services PMI is out at 9:45 AM EST. This is Major.
-
New Home Sales is out at 10 AM EST. This is Major.
-
Crude Oil Inventories is out at 10:30 AM EST. This is Major.
Traders, please note that we've changed the Bond instrument from the 10 year (ZN) to the 2 year (ZT). They work exactly the same.
We've elected to switch gears a bit and show correlation between the 10-year Treasury notes (ZN) and the S&P futures contract. The YM contract is the Dow Jones Industrial Average, and the purpose is to show reverse correlation between the two instruments. Remember it's likened to a seesaw, when up goes up the other should go down and vice versa.
Yesterday the ZT migrated Higher at around 8 AM EST with no economic news reported as of that time. If you look at the charts below the ZT gave a signal at around 8 AM and started its Upward ascend. Look at the charts below and you'll see a pattern for both assets. The Dow moved Lower at 8 AM and the ZT moved Higher at around the same time. These charts represent the newest version of BarCharts, and I've changed the timeframe to a 15-minute chart to display better. This represented a Long opportunity on the 2-year note, as a trader you could have netted about 20 plus ticks per contract on this trade. Each tick is worth $7.625. Please note: the front month for ZT is Sept and the Dow is now Sept '24. I've changed the format to filled Candlesticks (not hollow) such that it may be more apparent and visible.
Charts courtesy of barcharts
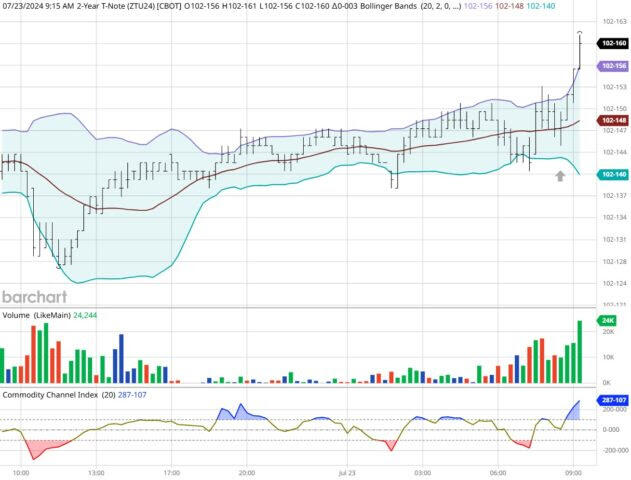
ZT -Sept 2024 - 07/23/24
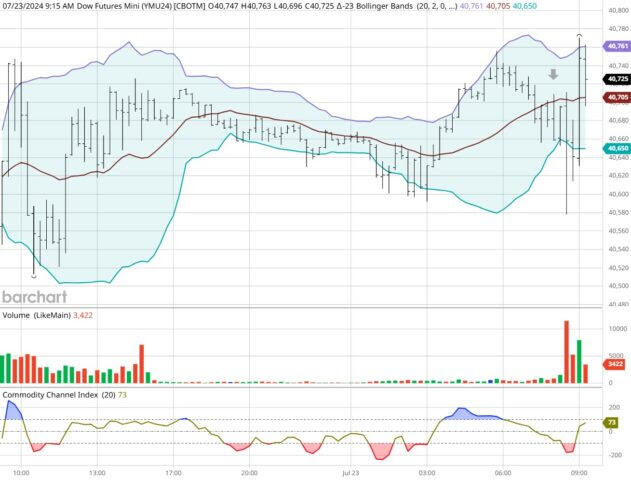
Dow - Sept 2024 - 07/23/24
Bias
Yesterday we gave the markets a Neutral or Mixed bias and up until the last 20 minutes of the session, the indices were Mixed. They ended in negative territory, so the Dow dropped 57 points and the other indices lost ground as well. Today we aren't dealing with a correlated market and our bias is to the Downside.
Could this change? Of Course. Remember anything can happen in a volatile market.
Commentary
Yesterday we gave the markets a Neutral or Mixed bias as we didn't see much in the way of Market Correlation Tuesday morning. Ironically the indices traded Mixed until the last 20 minutes of the session and then turned negative. We had two reports yesterday and none of them were stellar. Richmond Manufacturing and Existing Home Sales did not meet expectation. This shouldn't be a surprise for the real estate market as until interest rates are reduced, we will see this kind of performance in that market. Today we have New Home Sales, Flash Manufacturing Services and PMI as well as Crude Oil Inventories; all of which are major. Will this be enough to keep the Kamala momentum moving forward? As in all things, only time will tell...
Author

Nick Mastrandrea
Market Tea Leaves


