|

Is the double bottom formation a prelude to a EUR/USD uptrend?

Embarking into the second half of 2023, traders have witnessed the EURUSD cascade lower since mid-July, meticulously crafting a downward channel that is acutely demarcated with parallel black lines. This technical formation has encapsulated a clear bearish trend, entrapping the currency pair within a rigid downward trajectory and surfacing opportunities for persistent bearish positions.

Perusing the structure, one cannot help but observe the pair’s pronounced weakness, especially considering the dual tests of the lower boundary of the channel in recent sessions. Each descent towards this critical support has been met with a resilient defiance from buyers, momentarily halting the bearish momentum and teasing a potential respite from the perpetual downfall.

Chart

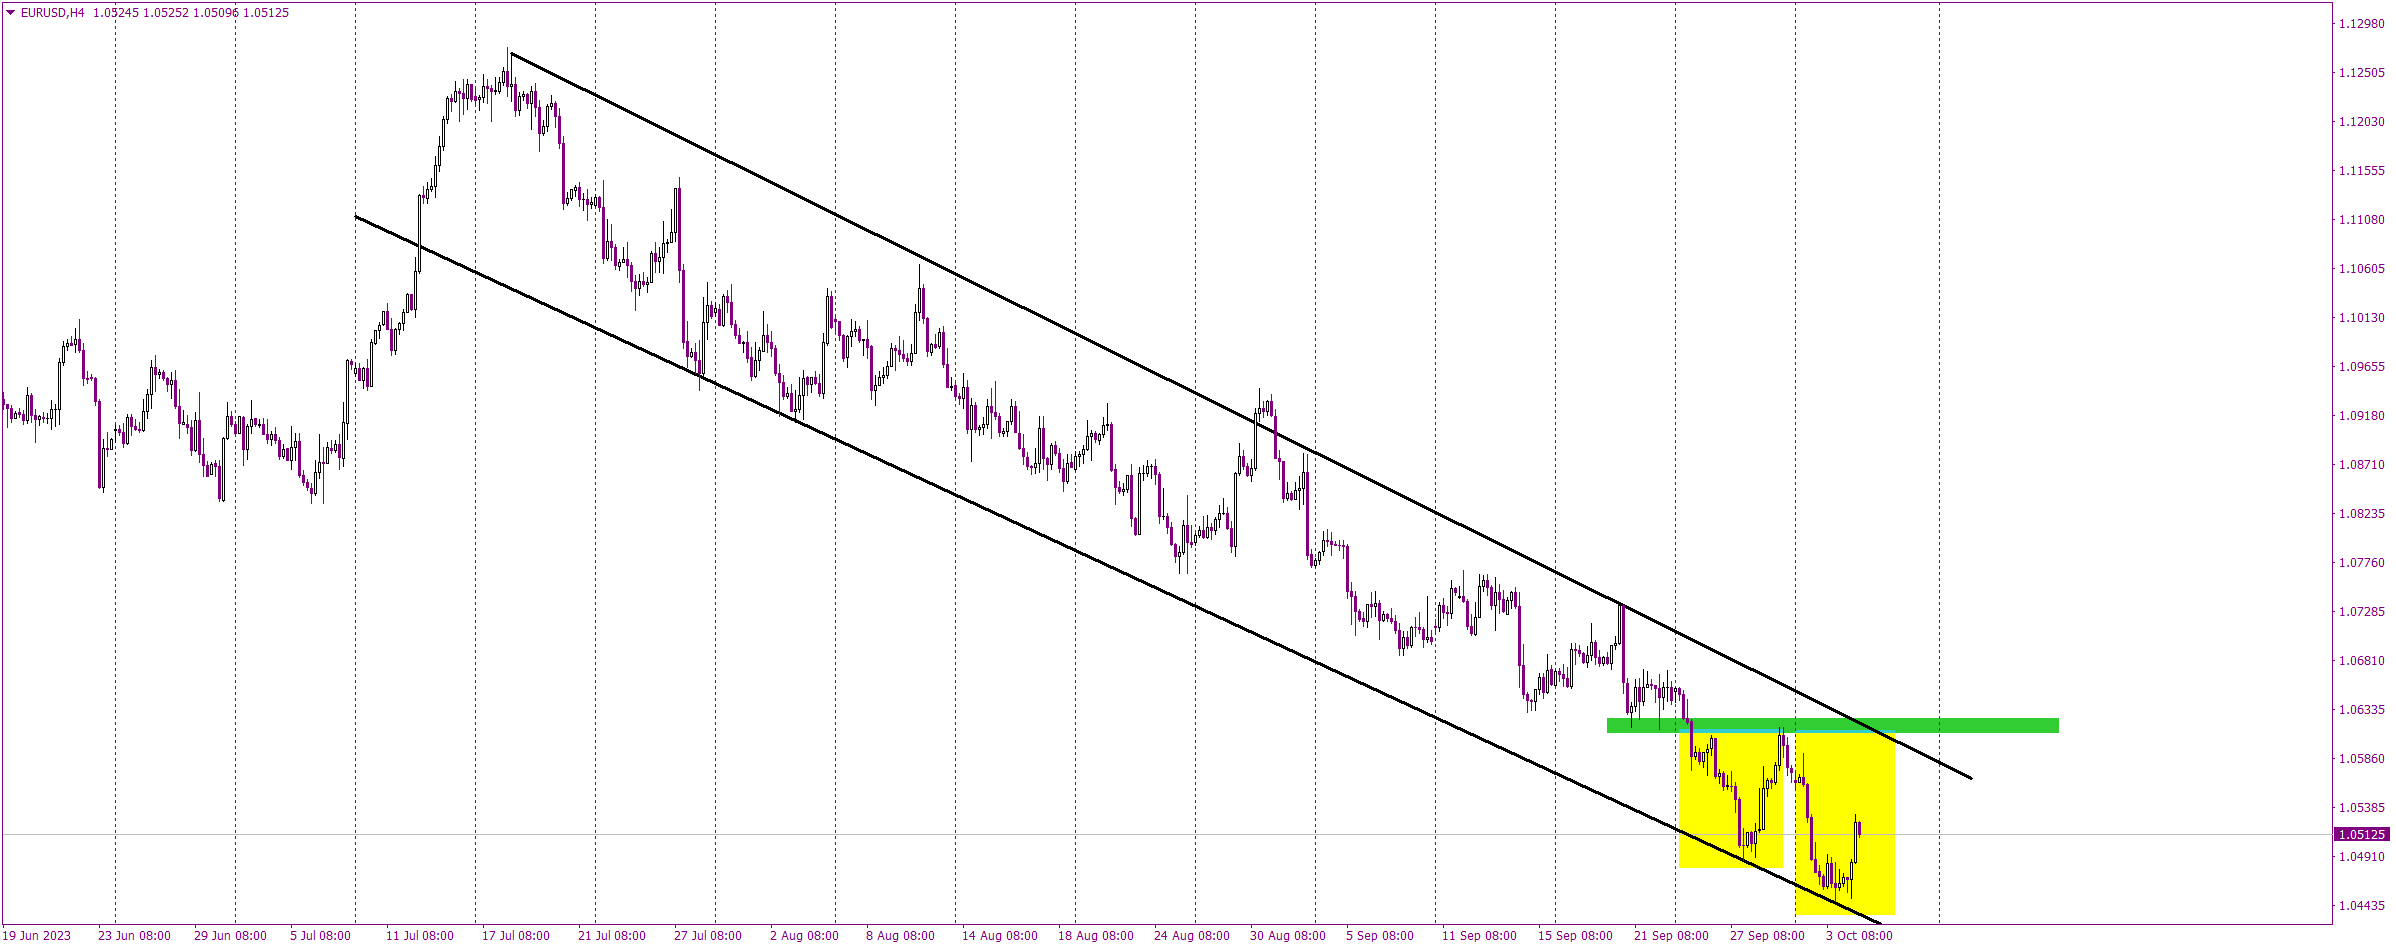
In the context of this bearish backdrop, a glimmer of bullish potential is beginning to surface. EURUSD appears to be crafting a ‘double bottom’ formation, distinctly highlighted by yellow rectangles that symbolize two prominent troughs in the pair’s journey. This technical pattern often heralds a potential reversal, especially when found after a notable downtrend.

Traders find themselves perched on the edge of anticipation, with eyes keenly fixated on a pivotal breakout above the upper black line of the channel down formation and a crucial green horizontal resistance. This line, acting as the neckline of the suggestive double bottom, becomes the make-or-break level for bullish proponents. A convincing daily close above these resistances signals an exhilarating shift into bullish territories, while a rejection, particularly one accompanied by bearish price action or candlestick formations, would reinvigorate the prevailing downtrend.

Author

Tomasz Wisniewski

Tomasz Wisniewski

Axiory Global Ltd.

Tomasz was born in Warsaw, Poland on 25th October, 1985.

More from Tomasz Wisniewski
Share:

Editor's Picks

EUR/USD consolidates around 1.0900, bullish bias remains ahead of key US data

The EUR/USD pair is seen consolidating its strong gains registered over the past two days and oscillating in a narrow band during the Asian session on Tuesday. Spot prices currently trade around the 1.1900 mark, just below an over one-week high touched the previous day.

GBP/USD tilts bullish as markets barrel toward mid-week NFP print

GBP/USD is holding a broader bullish structure on the daily chart, with price trading well above the 50 Exponential Moving Average at 1.3507 and the 200 EMA at 1.3310, confirming the intermediate uptrend that has been in place since the November 2025 low near 1.2300. 

Gold falls below $5,050 as traders await US jobs data

Gold price attracts some sellers near $5,035 during the early Asian session on Tuesday. The precious metal edges lower amid improved risk sentiment and some profit-taking. Traders brace for key US economic data later this week, including delayed employment and inflation reports. 

Litecoin eyes $50 as heavy losses weigh on investors

Following a strong downtrend across the crypto market over the past week, Litecoin holders are under immense pressure. The Bitcoin fork has trimmed about $1.81 billion from its market capitalization since the beginning of the year, sending it below the top 20 cryptos by market cap.

The market is buying everything again but is it dancing on a borrowed floor

The market has a short memory and a fast trigger finger. Last week’s liquidation barely cooled before risk came roaring back, pushing the S&P toward record territory and reinstalling Big Tech as the engine of choice. This is not discovery. It is re exposure.

Ripple exposed to volatility amid low retail interest, modest fund inflows

Ripple (XRP) is extending its intraday decline to around $1.40 at the time of writing on Monday amid growing pressure from the retail market and risk-off sentiment that continues to keep investors on the sidelines.