Is it time for trend reversal in natural Gas?

After a disappointing November and price declines, the bulls apparently lost the will to fight and allowed their opponents to reach even lower levels.
What’s new for Natural Gas?

Looking at the long-term chart, we see that after months of recovering from losses, the bulls have capitulated to the 50-month moving average, which triggered a downward move in November.
Thanks to the sellers’ attack, the price slipped and closed the month under 2.96, which resulted in a bearish engulfing pattern. This negative sign completely discouraged the bulls from acting, resulting in a widening of the decline this month and a fresh multi-month low of 2.23 (the lowest price since June).
Although we noticed some rebound (seen on the chart as a prolonged lower shadow of the current candle), can we trust the bulls to push the price to higher levels in the coming days?
Let's analyze the weekly chart for more clues.

From this perspective, we see that natural gas moved higher in the previous weeks, but despite recent promising candles (two doji dragonfly candlesticks) it is still trading under the red gap created in mid-Dec., which serves as the nearest resistance.
Additionally, the price remains below the previously broken 50-week moving average, which reinforces the mentioned resistance.
On top of that, natural gas is also trading under last week’s closing price of 2.49, which means that the gap between that price and this week’s opening price is still open and serves as an additional resistance.
Is there anything that speaks in favor of the bulls?
Yes – that is the current position of the indicators, but in my opinion, it is definitely not enough to believe that the bears have already given up the fight for lower levels.
Will the bulls find any allies in the short-term? Let’s check the daily chart below.

From today’s point of view, we see that the upward move between Dec. 13 and Dec.18 took natural gas to the resistance area created by the upper border of the red gap created on Dec. 11 and the previously broken 61.8% Fibonacci retracement (based on the entire April-October increase), which stopped the buyers and triggered a correction.
Although the buy signals generated by the CCI and the Stochastic Oscillator remain in the cards, the volume that accompanied the recent white candles was disappointing, which, in combination with the space of the red gap and the upper border of the red declining short-term trend channel (seen more clearly on the chart below) encouraged the sellers to act once again.
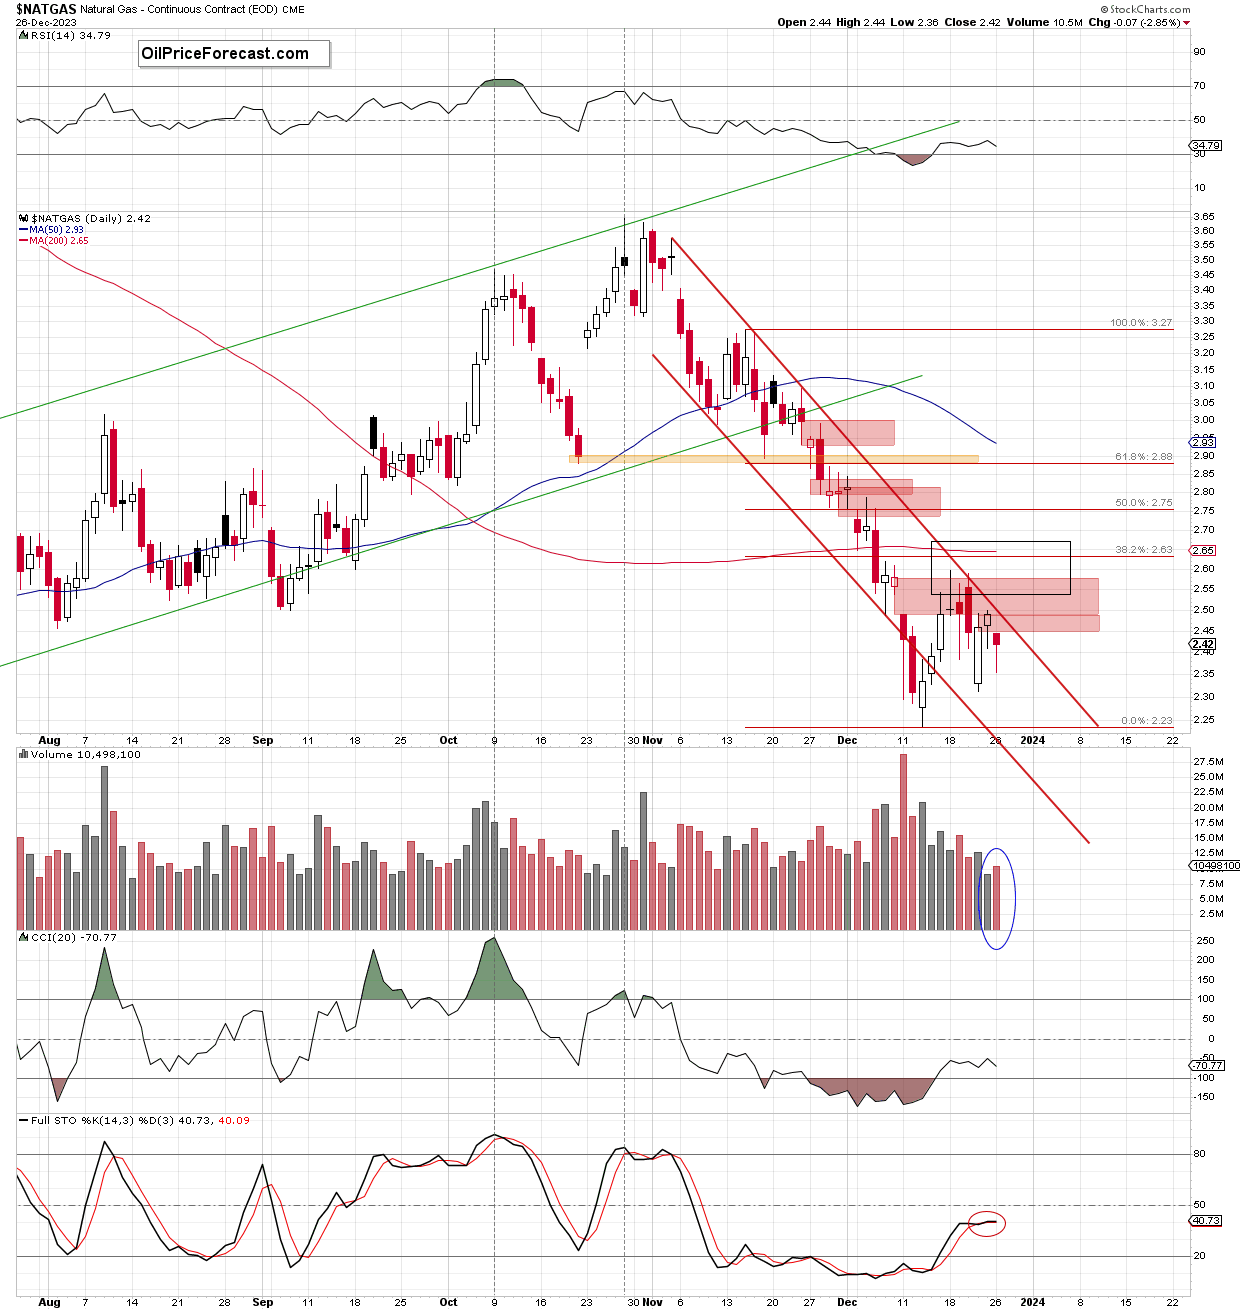
As a result, the price opened the post-holiday week under the Dec. 22 closing price, creating another pro-bearish gap. Additionally, yesterday’s volume was higher, signaling that further deterioration may be just around the corner.
What could it mean for the price of Natural Gas?
In my opinion, if the bulls do not manage to break above the upper line of the declining channel, we could see a test of the Dec. low of 2.235 in the very near future. However, if it is broken, the bears may want to check the strength of the buyers around 2.136-2.206, where the next support area (created by June lows) is.
Summing up, taking all the above into account, it seems that as long as the nearest resistances block the way to the north, another move to the downside is likely and at least a test of the Dec. low of 2.235 is very likely.
Want free follow-ups to the above article and details not available to 99%+ investors? Sign up to our free newsletter today!
Want free follow-ups to the above article and details not available to 99%+ investors? Sign up to our free newsletter today!
Author

Przemyslaw Radomski, CFA
Sunshine Profits
Przemyslaw Radomski, CFA (PR) is a precious metals investor and analyst who takes advantage of the emotionality on the markets, and invites you to do the same. His company, Sunshine Profits, publishes analytical software that any


