|

Iron Ore Elliott Wave technical analysis [Video]

Iron Ore Elliott Wave analysis

The SGX TSI Iron Ore Index serves as a critical benchmark for stakeholders in the iron ore market, including traders, miners, and steelmakers who rely on it for contract settlements and managing price risk. The index, derived from real-time transactions in the spot market, is widely viewed as a trustworthy reflection of market dynamics.

The index saw an unprecedented high of approximately $233 per dry metric ton in May 2021, driven by China's strong demand and supply disruptions. However, this peak marked the beginning of a significant correction, with the index tumbling over 68% to $73 by October 2022. A rebound followed, lifting the index to $143.5 by December 2023. Yet, in 2024, the recovery stalled, with the index dropping nearly 50% before showing signs of resurgence in September but about half of that was shed in October gain.

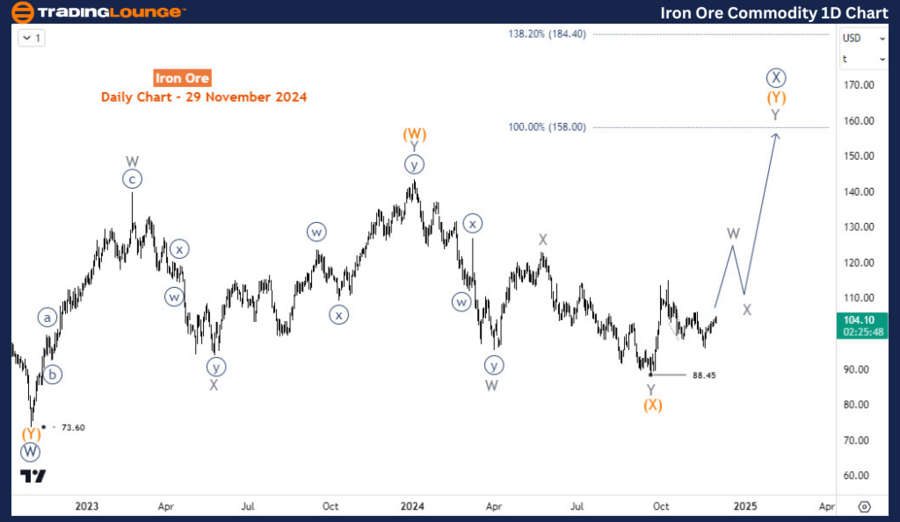
Daily chart analysis

Technically, a double zigzag structure is emerging from the low of October 2022. Wave (W) and (X) finished in January 2024 and September 2024 respectively. Thus, wave (Y) started at 88.45 and could extend up to 158 in the coming weeks or months.

Iron

Four-hour chart analysis

On the H4 chart, the price had a 5-wave rally to complete wave ((a)) of W of (Y) and then a pullback followed to 95.85 to complete wave ((b)). Wave ((c)) of W has started and could extend to 122.6. While pullbacks end above 95.85, the upside should extend in the coming days.

Commodities24(1).thumb.png.71f644cb76ef1e8c11b992e6418fc0d3.png

Iron Ore Elliott Wave technical analysis [Video]

Author

Peter Mathers

Peter Mathers

TradingLounge

Peter Mathers started actively trading in 1982. He began his career at Hoei and Shoin, a Japanese futures trading company.

More from Peter Mathers
Share:

Editor's Picks

EUR/USD hits two-day highs near 1.1820

EUR/USD picks up pace and reaches two-day tops around 1.1820 at the end of the week. The pair’s move higher comes on the back of renewed weakness in the US Dollar amid growing talk that the Fed could deliver an interest rate cut as early as March. On the docket, the flash US Consumer Sentiment improves to 57.3 in February.

GBP/USD reclaims 1.3600 and above

GBP/USD reverses two straight days of losses, surpassing the key 1.3600 yardstick on Friday. Cable’s rebound comes as the Greenback slips away from two-week highs in response to some profit-taking mood and speculation of Fed rate cuts. In addition, hawkish comments from the BoE’s Pill are also collaborating with the quid’s improvement.

Gold climbs further, focus is back to 45,000

Gold regains upside traction and surpasses the $4,900 mark per troy ounce at the end of the week, shifting its attention to the critical $5,000 region. The move reflects a shift in risk sentiment, driving flows back towards traditional safe haven assets and supporting the yellow metal.

Crypto Today: Bitcoin, Ethereum, XRP rebound amid risk-off, $2.6 billion liquidation wave

Bitcoin edges up above $65,000 at the time of writing on Friday, as dust from the recent macro-triggered sell-off settles. The leading altcoin, Ethereum, hovers above $1,900, but resistance at $2,000 caps the upside. Meanwhile, Ripple has recorded the largest intraday jump among the three assets, up over 10% to $1.35.

Three scenarios for Japanese Yen ahead of snap election

The latest polls point to a dominant win for the ruling bloc at the upcoming Japanese snap election. The larger Sanae Takaichi’s mandate, the more investors fear faster implementation of tax cuts and spending plans. 

XRP rally extends as modest ETF inflows support recovery

Ripple is accelerating its recovery, trading above $1.36 at the time of writing on Friday, as investors adjust their positions following a turbulent week in the broader crypto market. The remittance token is up over 21% from its intraday low of $1.12.