Iron Ore Elliott Wave technical analysis [Video]
![Iron Ore Elliott Wave technical analysis [Video]](https://editorial.fxstreet.com/images/TechnicalAnalysis/ChartPatterns/Candlesticks/high-resolution-stock-exchange-evolution-panel-55741904_XtraLarge.jpg)
Iron Ore Elliott Wave analysis
The SGX TSI Iron Ore Index serves as a critical benchmark for stakeholders in the iron ore market, including traders, miners, and steelmakers who rely on it for contract settlements and managing price risk. The index, derived from real-time transactions in the spot market, is widely viewed as a trustworthy reflection of market dynamics.
The index saw an unprecedented high of approximately $233 per dry metric ton in May 2021, driven by China's strong demand and supply disruptions. However, this peak marked the beginning of a significant correction, with the index tumbling over 68% to $73 by October 2022. A rebound followed, lifting the index to $143.5 by December 2023. Yet, in 2024, the recovery stalled, with the index dropping nearly 50% before showing signs of resurgence in September.
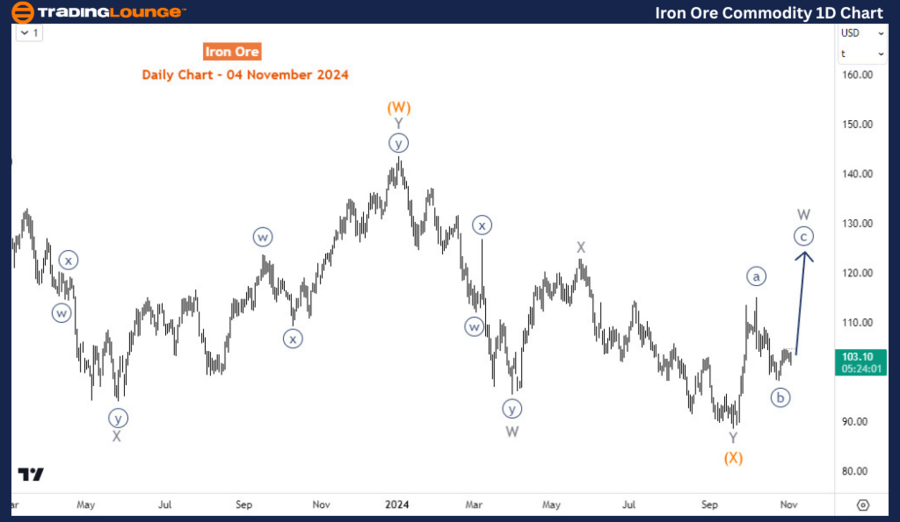
From an Elliott wave perspective, the daily chart reveals a multi-phase correction starting from the May 2021 peak. The initial decline completed wave ((W)) of the primary degree, bottoming out at $73.6 in October 2022. Subsequently, the price traced a bullish zigzag pattern, culminating in January 2024, before resuming a corrective downtrend. This decline appears to be corrective rather than impulsive, suggesting potential for further upside in the second phase, with a higher target in wave (Y) of X (circled).
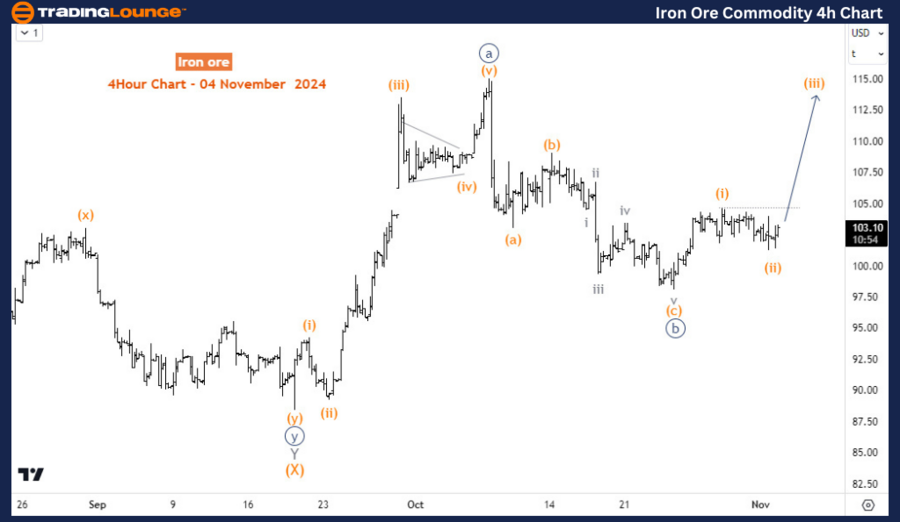
The H4 chart provides a closer look at the recent recovery from September's low, which formed a 5-wave impulse structure. Currently, the index is in a 3-wave corrective pullback labeled as waves ((a)) of ((b)) of W of ((Y)). As long as the pullback concludes above the September low, the outlook remains favorable for continued upside movement.
In summary, while the SGX TSI Iron Ore Index has undergone a complex correction, the wave structure supports a bullish continuation in the medium term. Traders may look for a completed pullback as a potential entry signal for wave (Y), targeting levels above the recent lows.
Iron Ore Elliott Wave technical analysis [Video]
Author

Peter Mathers
TradingLounge
Peter Mathers started actively trading in 1982. He began his career at Hoei and Shoin, a Japanese futures trading company.


