Iron Ore Elliott Wave technical analysis [Video]
![Iron Ore Elliott Wave technical analysis [Video]](https://editorial.fxstreet.com/images/Markets/Commodities/Metals/metal-shavings-gm133537548-17887573_XtraLarge.jpg)
Iron Ore Elliott Wave analysis
The Iron Ore Index is a vital benchmark in the iron ore market, providing essential insights for traders, miners, and steelmakers involved in contract settlements and managing price risks. This index is grounded in actual transactions within the iron ore spot market, making it a reliable indicator of market trends.
The index reached a historic peak of around $233 per dry metric ton in May 2021, fueled by robust demand from China and supply disruptions among key producers. However, this high signaled the onset of a significant correction, with the index plunging by over 68% to $73 by October 2022. A recovery phase ensued, elevating the index to $143.5 by December 2023. However, the recovery has met a setback in 2024, plunging nearly 50% before the most recent recovery from September.
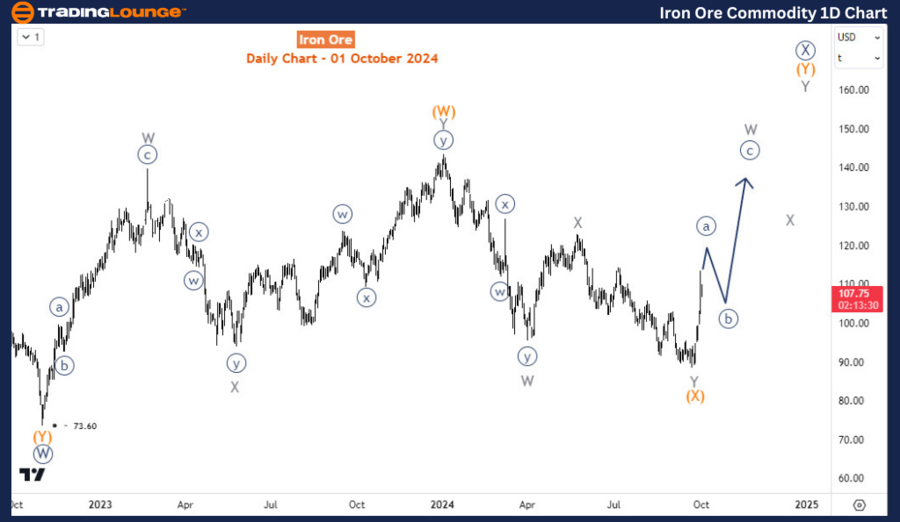
On the daily chart, we captured the 2nd phase of the bearish corrective phase from the all-time high that was reached in May 2021. The first phase completed wave W (circled) of the primary degree on 31st October 2022 at 73.6. Since then, the price completed another bullish zigzag structure in January 2024 before the all-year decline started. However, the decline has been corrective as well, prompting a forecast for the 2nd phase from 73.6 higher. It appears the most recent rally from the September low could develop much higher for wave (Y) of X (circled).
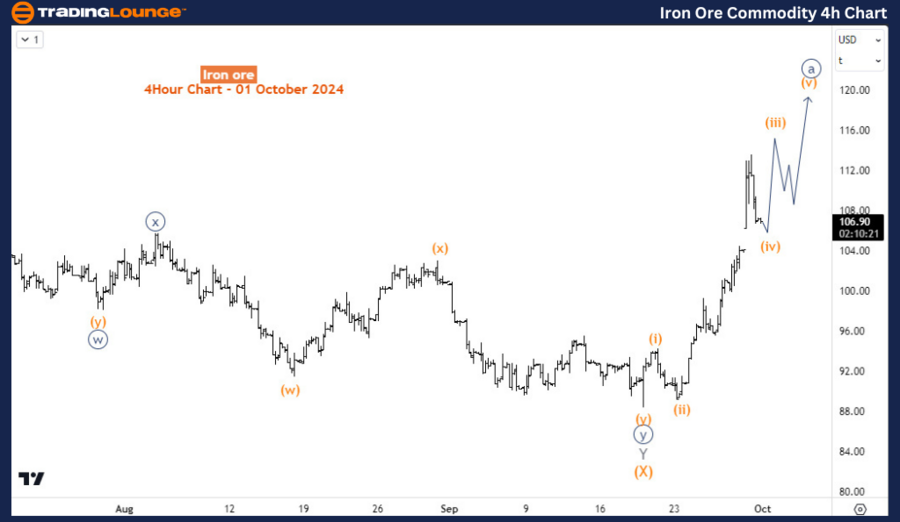
On the h4 chart, recovery from the September low is an impulse wave structure and can be the wave ((a)) of W of (Y). This forecast supports the upside in the short and medium term. Thus, while pullbacks end above the September low, traders can buy the dip for wave ((b)) or X if the price plays as this forecast suggests.
Iron Ore Elliott Wave technical analysis [Video]
Author

Peter Mathers
TradingLounge
Peter Mathers started actively trading in 1982. He began his career at Hoei and Shoin, a Japanese futures trading company.


