Iron ore Elliott Wave technical analysis [Video]
![Iron ore Elliott Wave technical analysis [Video]](https://editorial.fxstreet.com/images/MoneyManagement/PositionSizing/vintage-iron-weights-gm490557505-39720356_XtraLarge.jpg)
Iron ore Elliott Wave technical analysis
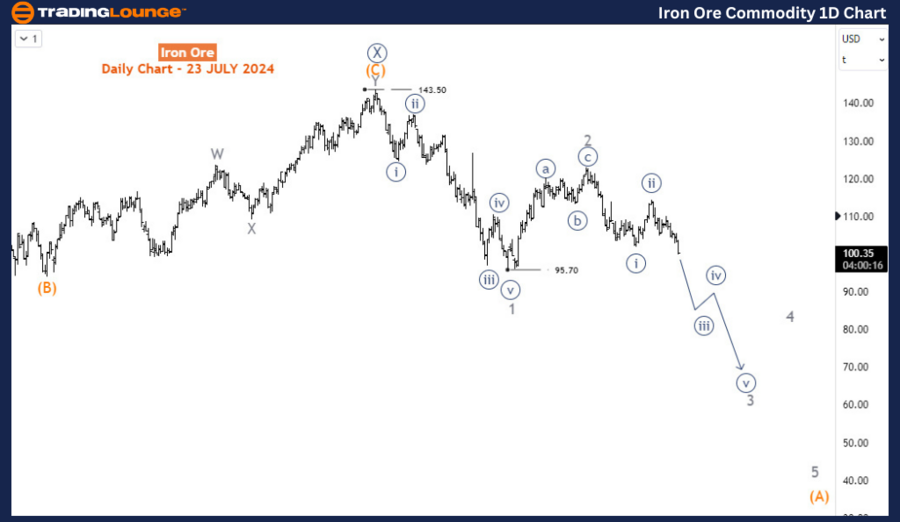
Function - Counter-trend.
Mode - Corrective for 2.
Structure - Impulse for wave (A).
Position - Wave 3 of (A).
Direction - Wave 3 of (A) is still in play.
Details - After breaking below 102, we have resorted to this outlook confirming wave X (circled) has finished at 143.5 and the price is down with an impulse or a 3-wave that could reach 60-70.
As an Elliott Wave analyst, the SGX TSI Iron Ore Index offers crucial insights into the iron ore market, serving as a key benchmark for traders, miners, and steelmakers involved in contract settlements and price risk management. The index's performance is based on actual transactions in the iron ore spot market, providing a reliable reflection of market conditions.
Overview and long-term analysis
The index peaked in May 2021, reaching an all-time high of around $233 per dry metric ton, driven by strong demand from China and supply constraints among major producers. Since then, the index has experienced a significant decline, dropping by over 68% to $73 by October 2022. However, it saw a notable recovery, climbing to $143.5 by December 2023. Despite this recovery, the index has entered a negative phase, with a resurgence beginning in April 2024 now being wiped out, potentially setting the commodity towards the lows seen in 2022.
In the long-term analysis, the index started a bearish corrective phase in May 2021, forming a primary wave W-X-Y (circled). The primary degree waves W and X (circled) ended at the October 2022 low and January 2024 high, respectively. Wave Y (circled) commenced from the January 2024 high of 143.5 and is expected to develop into a 3-wave structure consisting of intermediate degree waves (A)-(B)-(C). Currently, the price is in wave 3 of (A), which could continue to 45, indicating a 56% decline from the current price. This projection suggests a bearish long-term outlook for the index based on the Elliott Wave theory.
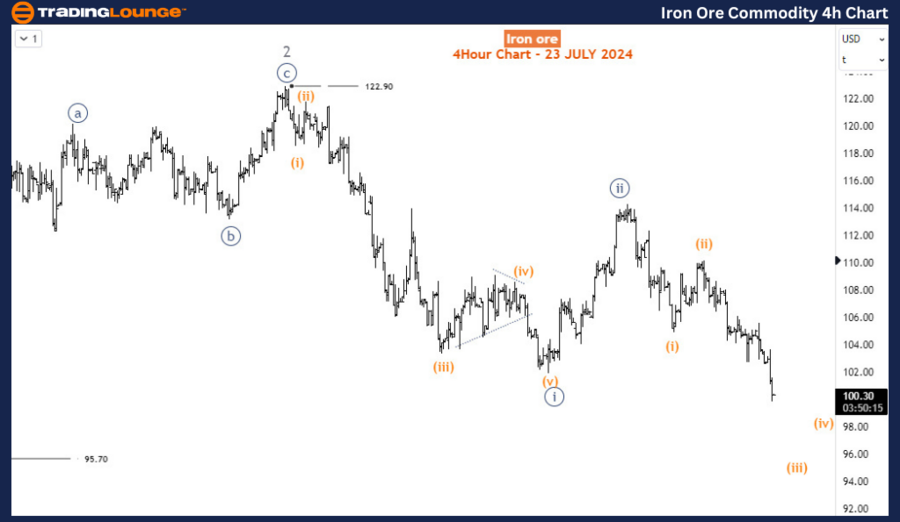
Four-hour chart analysis
On the H4 chart, wave 3 began at 122.9 and is currently unfolding its 3rd sub-wave, wave iii (circled) of 3. A closer examination reveals the price is in wave (iii) of iii (circled) of 3. In the immediate term, wave (iii) could reach 85 before a corrective bounce for wave (iv) and a further decline.
Summary
In summary, the Elliott Wave analysis indicates that the SGX TSI Iron Ore Index is in a significant bearish corrective phase. Key levels to monitor include the immediate target of 85 for wave (iii) and the longer-term target of 45 for wave 3 of (A). The index's path appears bearish from both long-term and short-term perspectives, suggesting potential opportunities for traders and investors to align their strategies accordingly. By closely monitoring wave structures and key price levels, stakeholders can anticipate future movements in the iron ore market, leveraging these insights for effective decision-making and risk management.
Iron ore Elliott Wave technical analysis [Video]
Author

Peter Mathers
TradingLounge
Peter Mathers started actively trading in 1982. He began his career at Hoei and Shoin, a Japanese futures trading company.


