Iron Ore Elliott Wave technical analysis [Video]
![Iron Ore Elliott Wave technical analysis [Video]](https://editorial.fxstreet.com/images/MoneyManagement/PositionSizing/vintage-iron-weights-gm490557505-39720356_XtraLarge.jpg)
Iron Ore Elliott Wave analysis
Function - Counter-trend.
Mode - Corrective for 2.
Structure - Double Zigzag.
Position - Blue wave ‘b’ (circled).
Direction - Blue wave ‘c’ (circled).
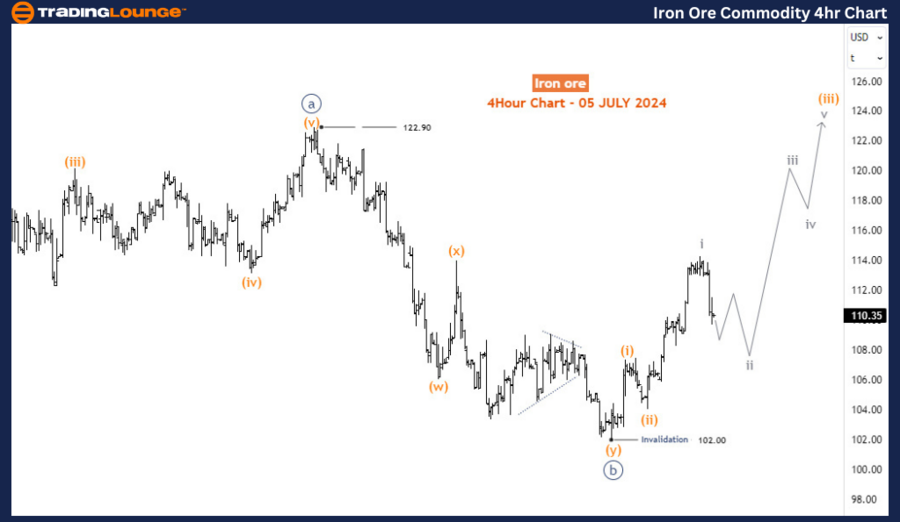
Details - The metal has completed the circled wave b and is now up in wave c (circled) with an impulse that should break above the 122.9 high. Bullish confirmation happened above 109.3.
The SGX TSI Iron Ore Index is a critical benchmark in the iron ore industry, widely used by traders, miners, and steelmakers for contract settlements and price risk management. The index reflects the true market price as it is based on actual transactions in the iron ore spot market.
The index peaked in May 2021, hitting an all-time high of around $233 per dry metric ton. This peak was driven by robust demand from China and supply constraints from major iron ore producers. Since this peak, the index has experienced a significant decline. By October 2022, it had dropped by over 68%, reaching $73. However, there was a notable recovery, with the index climbing to $143.5 by December 2023. Following this recovery, the index entered a negative phase, despite a resurgence that began in April 2024.
Analyzing the daily chart reveals that the price action from the all-time high in May 2021 can be viewed as a corrective bearish cycle forming a double zigzag structure in the primary degree, labeled as waves W-X-Y (circled). The primary degree wave W concluded at $73 in October 2022, and wave X ended at $143.5 in December 2023. The subsequent decline from December 2023's high of $143.5 is considered to be part of wave Y (circled), expected to form a zigzag or double zigzag structure.
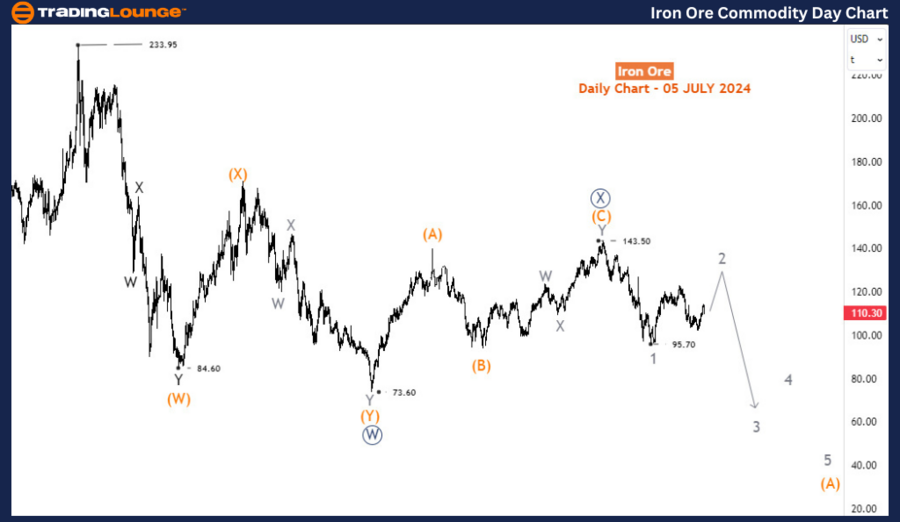
Wave Y (circled) suggests that the decline from $143.5 is part of wave (A) of Y, potentially forming a 5-wave or 3-wave structure. The drop to $95.7 could be wave A or 1, with the current recovery representing wave B or 2. These counts are provisional until the price action confirms the correct one. The critical factor now is the recovery from $95.7, which is anticipated to be a 3-wave structure completing below $143.5. The H4 chart indicates that the first two waves, wave a and b (circled), have likely concluded at $122.9 and $102, respectively. Consequently, wave c (circled) on the H4 chart is expected to advance higher, completing wave 2 or B.
The H4 chart further details the progression of wave c (circled) and its anticipated path, provided the $102 level is not breached. An upward movement to $122.9 and beyond is projected to follow.
This analysis underscores the dynamic nature of the iron ore market and the importance of the SGX TSI Iron Ore Index in providing a reliable gauge for market participants.
Iron Ore Elliott Wave technical analysis [Video]
Author

Peter Mathers
TradingLounge
Peter Mathers started actively trading in 1982. He began his career at Hoei and Shoin, a Japanese futures trading company.


