Iron ore Elliott Wave technical analysis [Video]
![Iron ore Elliott Wave technical analysis [Video]](https://editorial.fxstreet.com/images/Markets/Commodities/Metals/metal-shavings-gm133537548-17887573_XtraLarge.jpg)
Iron ore Elliott Wave technical analysis
Function - Counter-trend.
Mode - Corrective for 2.
Structure - Impulse for blue ‘a’.
Position - Blue wave ‘a’.
Direction - Blue wave ‘b’.
Details - Price turning downside off the reversal zone means blue wave ‘b’ could have started. However, we can’t write-off the chances of wave (v) of blue ‘a’ returning upside and higher into the zone. We will wait for the end of blue wave ‘b’ before going LONG.
The SGX TSI Iron Ore Index Futures is a financial derivative traded on the Singapore Exchange (SGX). It is used to hedge or speculate on the price movements of iron ore, a key raw material in steel production.
FEF! has been on recovery since late March 2024 and has now gained over 24% since that time. The bounce is completing an impulse indicating the high likelihood of an extension to the upside in the medium-term. However, the long-term trend appears bearish. Thus, after the corrective recovery has been concluded, sellers can regain control.
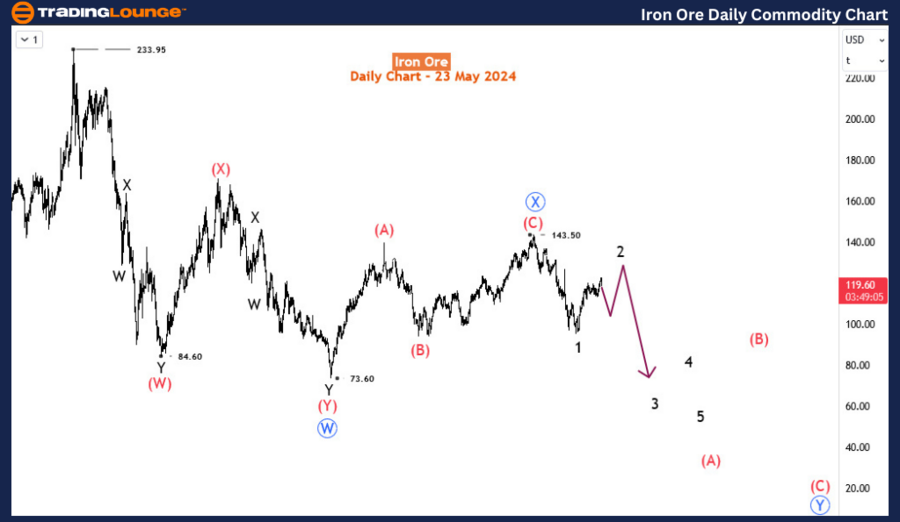
On the daily chart, the medium-term term trend is somewhat sideways. However, the trend from May 2021 is bearish. The bearish trend started at 233.95 in May 2021 and completed a double zigzag corrective structure in October 2022 at 73.6. Price followed that with another zigzag structure which ended at 143.5 in January 2024. With this picture, we can anticipate a primary degree double zigzag from the top of 233.95. Primary degree wave ‘X’ (circled) ended at 143.5 and the corresponding primary degree wave ‘Y’ has now begun. We could either get an A-B-C structure or W-X-Y for primary degree blue wave B. At the moment, the price is correcting the first decline from 143.5. This means that once the correction is concluded, the bears should take control again. to prices below 73.6.
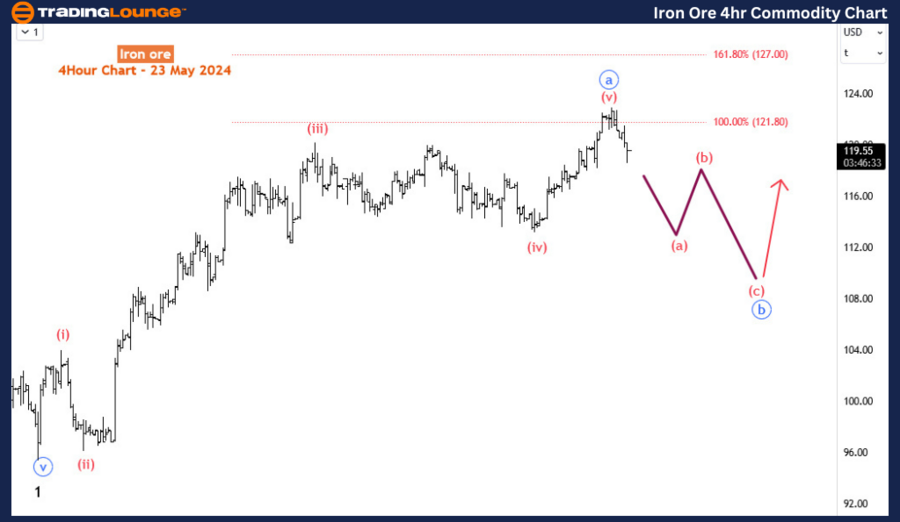
On the H4, we investigate the current bullish correction - wave 2. Wave 2 is close to completing an impulse wave which should be it’s first leg - blue wave ‘a’. After blue ‘a’, we should see a corrective pullback for blue wave ‘b’ expected to complete above the low of wave 1 at 95.4. Afterwards, wave 2 should resume higher in blue wave ‘c’. Buyers will have another opportunity to advance the recovery after finding a common support for blue wave ‘b’ leading to blue wave ‘c’. However, we can expect the recovery to be limited before sellers take over for wave 3 after wave 2 find a common resistance area.
Iron ore Elliott Wave technical analysis [Video]
Author

Peter Mathers
TradingLounge
Peter Mathers started actively trading in 1982. He began his career at Hoei and Shoin, a Japanese futures trading company.


