Increasing Technical Weakness

Market Overview
Last Monday, SPX Made a new all-time high at 3017.80 in a “last hurrah” attempt at keeping the bullish uptrend going. But it came with signals of trouble ahead. Besides its failure to rise to the top of the bullish channel from 2728 (which was a classic sign of deceleration), the strongest warning came from the A/Ds daily pattern which was thoroughly discussed in last week’s letter. I pointed out that it was forming an ominous pattern which, in the past, had normally led to an important correction. In addition, this was the third such warning since the low of 2346, making it all the more serious because in the market, things often come in threes with the third repetition marking the end of the prevailing pattern.
Last week’s action shows that the uptrend is in trouble. On Monday, the opening thrust was the high of the day and marked the beginning of a 43-point decline engineered by the short-term cycle which had been thoroughly discussed in the past two weeks, but was delayed by the probability of a rate cut at the next FOMC meeting (7/30-31). On Thursday, another mention of that rate cut created a sharp 70% retracement of the decline which served as a retest of the high. Buton Friday, weakness resumed and increased materially with the index closing on its low of the day and continuing with more selling in the futures after the close. It would take some sort of technical aberration to prevent SPX from opening lower on Monday!
The next two or three weeks will be a defining period for the market which, at this time, favors the bears.
Technical Analysis (Charts appearing below are courtesy of QCharts.)
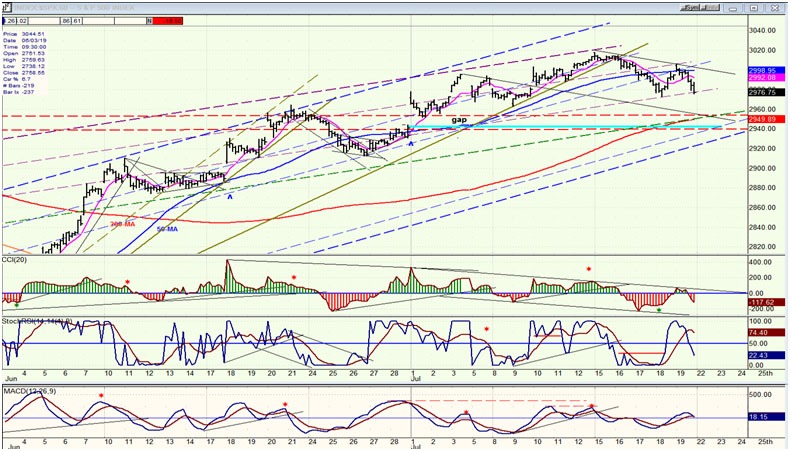
The intermediate trend deceleration is becoming more obvious as each week goes by. Starting from 2346, SPX moved up at a sharp angle until it reached 2820, and then had its first 100-point correction. This allowed us to establish the parameters for the blue channel. Prices then continued to move up, but at a less steep angle, until they reached 2854 and started a deeper correction which took them outside of the blue channel. We were then able to draw the top and bottom lines of the purple channel which is much wider than the original one. From 2854, the index corrected until it retraced exactly .382 of the entire rise from 2346 before turning up again and moving even higher, finally creating another top last Monday at 3018. If, as I expect, the fledging decline expands into a full-blown correction, the 3018 top will have ended the third phase of deceleration since the move started at 2346. 3018fell far short of the current purple channel top lineand I would not be surprised if this correction took the index outside of the channel entirely before it ends. I have drawn a red trend line connecting the 2954 and 3018 tops because, even though the entire uptrend is not shown on the chart below, this helps us to visualize the formation as a large rounding top which is just beginning to roll over. This is deceleration on a large scale which portends a significant correction just starting. I have also established a new red channel by drawing a parallel to the top red line,and I suspect that this decline, if it continues lower past the end of the monthwill not only take us outside of the purple channel, buteven below that lower red channel line.
This correctionwould be consistent with the cycles expected to bottom in August/September. On Friday, the oscillators all closed negative for the first time since early May. It’s possible that we are starting a similar and perhaps larger correction, but only if we first break out of the dashed blue channel overthe short-term. The current minor cycle which is supposed to bottom on Monday/Tuesday should take us to about 2950 before causing a rebound into the end of the month. A resumption of the decline after that date should next bring us down to challenge the 50-dma. I have marked on the chart the approximate index action I expect to seeover the next couple of weeks. This market activity would bring additional congestion (distribution) in the topping area and give us a better estimate of how far the correction couldextend.
SPX daily chart

SPX hourly chart
SPX topped early Monday at 3018, drifted sideways for the rest of the day, and started an initial correction on Tuesday which was interrupted by a sharp rally after touching 2975. I briefly thought that the cycle low due next week might have come a little early, but Friday’s retracement which continued into the close and was followed by continued selling in the futures suggests otherwise. There is a near-term P&F count to about 2950 which looks like an appropriate target as it fulfills the rest of the cycle down-phase. That’s also the junction of trend and parallel lines which should arrest the decline. The opening gap of 7/1 may also get filled at that time.
The cycle low should next bring a rebound which could extend into the FOMC meeting at the end of the month. Next, SPX will have to prove that it started more than just a downside blip after making a new high at 3018. It will have to roll over once more, and this time break below the lower line of the channel represented by the two blue dashed lines. Only after doing so will it confirm that it is now on its way to an August/September low.
QQQ, SPX, DJIA, IWM (weekly)
Last week marked the collective reversal of all four indexes, except for the fact that IWM did so from a much lower level while even increasing its relative weakness to the rest of the group; thereby putting into considerable doubt the validity of the view that the market is going to continue with its bullish ways. I have drawn a red “channel” on the first three charts which duplicates the one drawn on the daily chart. It seems that IWM already created the same red channel several weeks ago, but at a much lower level. Furthermore, it has already fallen through the lower channel line; although it did rally into it as the other indexes all made new highs. During this process,a much weaker IWM remained within the confines of its larger descending red channel. This pronounced, relative weakness significantly increases the risk of a significant correction directly ahead.

UUP (dollar ETF) daily
Last week, UUP sold off sharply on Thursday and climbed right back up on Friday. Next week should determine the short-term direction.

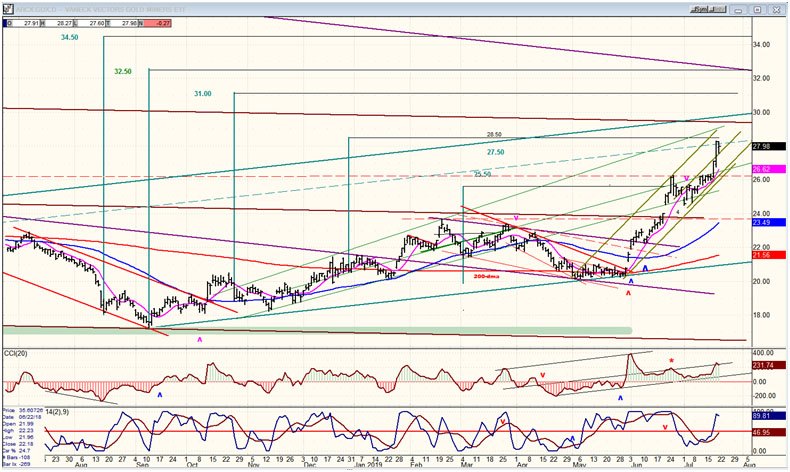
GDX (Gold miners ETF) daily
The chart posted below includes phase counts derived from the base which GDX has just completed. The entire base calls for a move to 61, but this is not something that is going to take place next week, or even this year. In the meantime, the short-term counts are working well and we could get up to about 31-32.50 before GDX completes this bullish phase and has a significant consolidation.
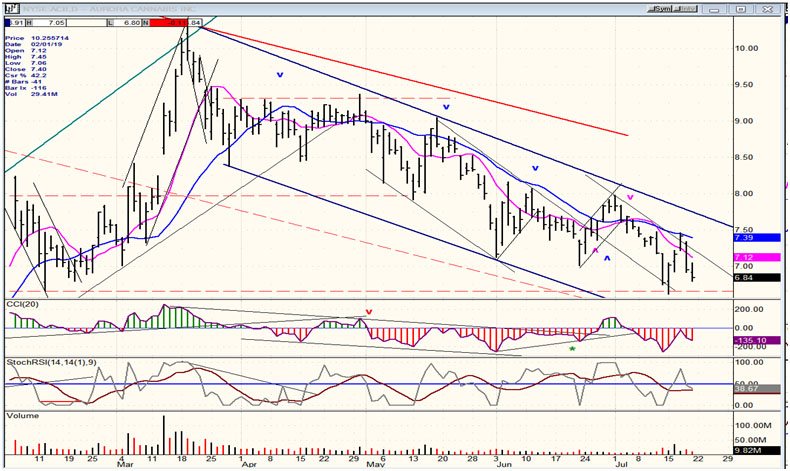
ACB (Aurora Cannabis) daily
ACB has been making small upside probes to see if it is ready to end its intermediate consolidation, but they have all been turned back. 5.50 is possible before the end of this decline.
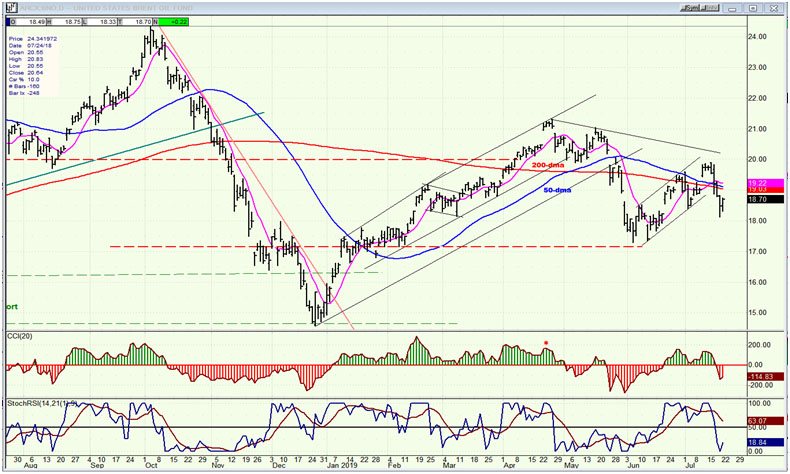
BNO (U.S. Brent oil fund) daily
BNO has ended its short-term rebound. A deeper pull-back is expected now that it has moved back below its MA cluster.
Summary
After being stymied by discussions of a rate cut at the next FOMC meeting (7/30-31) the minor cycle has regained control and is expected to drive prices lower into Monday/Tuesday.
Author

Andre Gratian
Market Turning Points
When I was a stock broker years ago, a friend introduced me to technical analysis of the market and it is not an exaggeration to say that I fell in love with this approach! Ever since then, it has become an increasingly important


