Imports and exports: Australia, Canada, United States

Import price index rose 0.8% this quarter and fell 2.4% through the year.
AUDUSD Export price index fell 3.1% this quarter and 10.7% through the year.
Most vital
Imports Yearly drop 2.4%.
Exports yearly drop 10.7%
With Exports miles above Imports, Producer Prices are at extremely high levels. Australia and most economies look like Japan in August and October 2022 as Imports beat Exports and Producer Prices were skyrocket high. Japan and the BOJ corrected and fixed the trade problem immediately by intervention to USD/JPY.
Above pretty much looks like every central bank on the planet except for Japan. In the United States, Imports beat Exports every month since 2021. How is such a disaster fixed. All nations desperately require lower interest rates to right size exports to imports.
Inflation for most most nations account for 0.4 or 40% of the CPI Index and results as the big mover to Import and Eport Lines. Japan"s CPI index account for 0.2 or 20% of the CPI Index.
The overall concern is trade wars between nations such as occurred in the 1930’s particularly if markets crash or severe recessions commences.
The Glue and driver that holds Exports and Imports is Producer Prices and pretty much the same economic indicator for all nations. True for Australia, Japan, New Zealand, United States, Canada and assumption for GBP, Swiss, Europe.
This doesn’t cover how Inflation and GDP is seen miles in advance but here’s Australia quoted from the RBA = The Stage of Production indexes inform on inflationary trends by an economic categorization of transactions according to their sequencing in the production chain.
Simplified. Producer Prices from early pricing to monthly imports and exports sees Inflation in advance. Australia gladly shows every last detail to trade in many, many pages except for most vital Calculations.
Australia Imports sees higher Inflation, lower GDP unless Exports rise above Imports. Another rise in interest rates will devastate Australia.
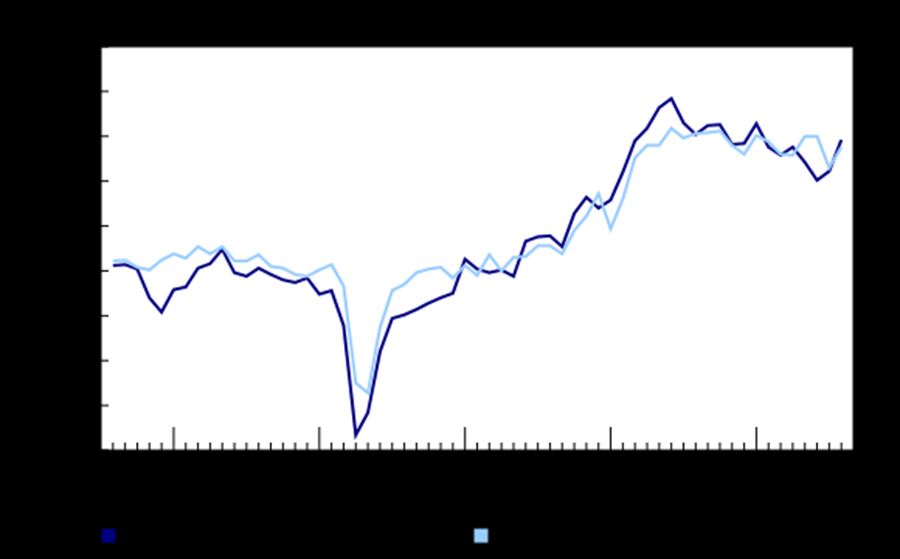
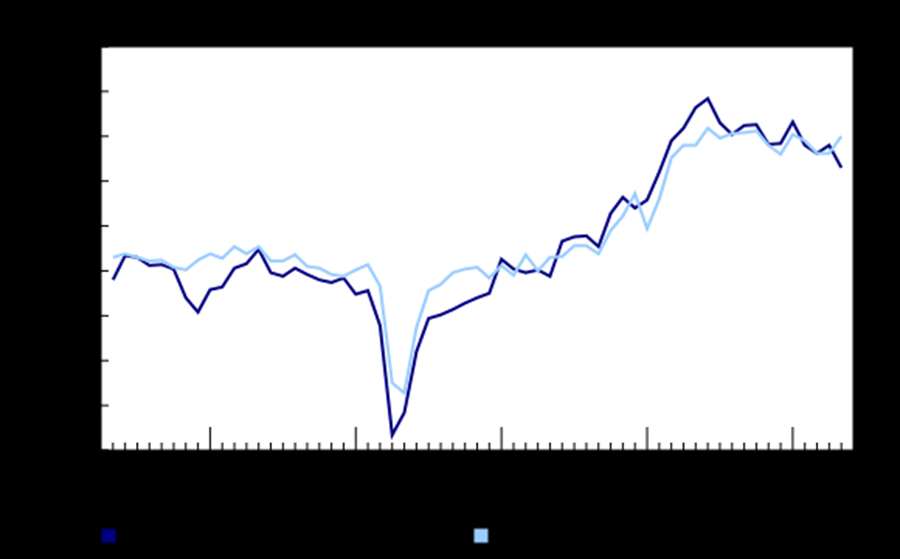
Canada provides a rare public view to Import and export lines charted while every nation on the planet provides views only on Central bank websites. Canada is the exact replica to the current charts for the United States.
Higher Inflation was the result of higher Import Prtices. Note the spike in the first chart at the the Blue Import Line.
Import Lines = Inflation, Interest Rates, Exchange Rates, Producer Prices, Oil,
Balance sheets?
Proper = Exchange rate should be dead center to Import and Export Lines.
Export Lines = GDP, Money Supplies, Unemployment, Wages, Consumption and Consumer Confidence, Corporate Profits, Fixed Investments, stock markets,
The monthly Import and Export lines move slowly because Inflation, GDP, Economic releases move per month by 0.2 and 0.3 or 20% and 30%. Seen more specifically by decimals as 0.002 and 0.003. Exchange rates fail to move significantly under such low numbers especially when consensus estimates closely inform to the actual release.
Import and Export lines represent monetary policy for all nations and the balancing act to competing interests as Inflation Vs GDP, Money Supplies Vs Interest rates, Producer prices Vs Consumer Confidence and Consumer activity.
Relationships to economic releases share adverse interests. Note the Philipps Curve as adverse to Unemployment and Inflation. Philipps curves failed due to the mismatch to Unemployment.
For all nations currently, interest rates, Producer Prices and Inflation is mies to high. A drop in interest rates rectifies Exports above Imports and growing economies.
Author

Brian Twomey
Brian's Investment
Brian Twomey is an independent trader and a prolific writer on trading, having authored over sixty articles in Technical Analysis of Stocks & Commodities and Investopedia.