![]() Przemyslaw Radomski, CFA
Przemyslaw Radomski, CFA
Sunshine Profits
Last week, the USD Index stole the spotlight. It truly soared. But…Very few people are actually long.
USD Index surges amid short covering
Yup. Even though the USDX moved high so profoundly, it wasn’t fresh buying that pushed the price higher. It was a short covering, and it has major implications going forward.
How do I know? Because we see that open interest for the USD Index futures dropped and it remains at very low levels, while the volume moved higher.
As a reminder, volume means how many shares (or, in this case, futures contracts) traded. How many of them changed ownership. Open interest, however, shows how many contracts are open.
The chart below might seem complex but trust me – it’s worth spending some time on it.
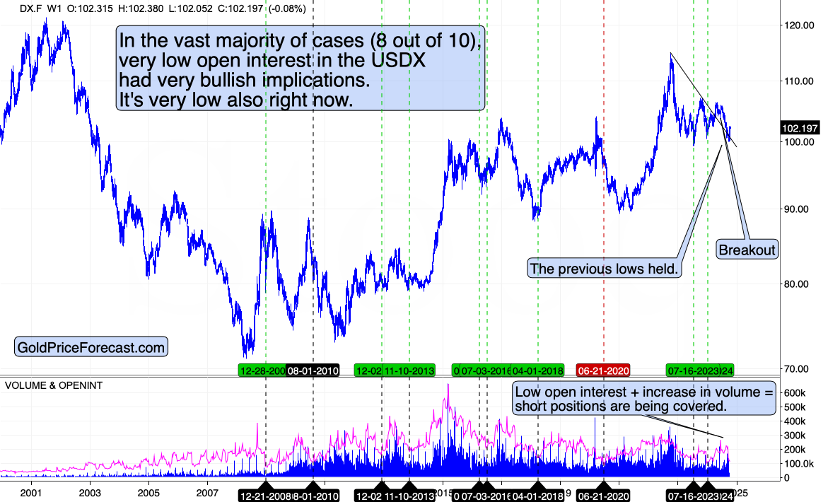
In the last 24 years, there was a limited number of cases when open interest in the USD Index was very low. And if we count only those cases where open interest dropped and was low on a relative basis, we get 10 situations similar to what we see right now.
I marked all of them with vertical lines. I marked 8 of those 10 with green, as that’s when these moments were good buying opportunities. There was one with bearish implications (red), and one (black) with bullish implications for the short term and bearish for the medium term.
Overall, the implications of low open interest in the USDX were generally bullish – 80% is a big majority.
The price moves that followed were not small, either. Conversely, the USD Index usually rallied significantly in the months that followed the moment when open interest moved to very low levels.
This happened twice before the powerful 2014 – 2015 rally, for example.
Some may say that last week’s rally was significant. That’s true – it was the biggest rally that we saw in a long time. However, at the same time, taking a broader point of view, and looking at what’s really happening in the market shows us that the rally in the USD Index is likely just starting.
In the previous cases the jump in volume wasn’t as notable. This most likely means that the short covering mechanism wasn’t as profound as it’s been recently.
Why is this important?
Because that’s how the biggest rallies tend to start (or end) – with short squeezes. The parties that were suppressing the price (by shorting the market) exit it, thus allowing it to move higher, but so far, the regular buyers – those who would simply go long – are not yet entering the market. It’s later when those investors enter, thus fueling and extending the rally.
This means that what we see on the chart (that 80% accuracy) is likely to be true and a really big rally is likely to follow here.
This, of course, has profound implications for pretty much all other markets, including precious metals.
The implications for gold, silver, and mining stocks are obvious – they are bearish, as the prices of precious metals won’t rally while the currency that they are priced in is soaring. Sure, it might be happening from time to time, but… Gold already reached its upside target based on the Fibonacci extension technique, and silver already invalidated its move to new highs (yup, another silver fake out). Don’t get me wrong, there are (just my opinion, not investment advice) excellent long-term prospects for silver, but I don’t think it would rally right away.
The soaring USD Index might also be the thing that triggers a sell-off on the stock market. For now, stocks remain close to their all-time highs, but with exports becoming more expensive for foreign buyers, the U.S. economy – and stocks – might take a hit.
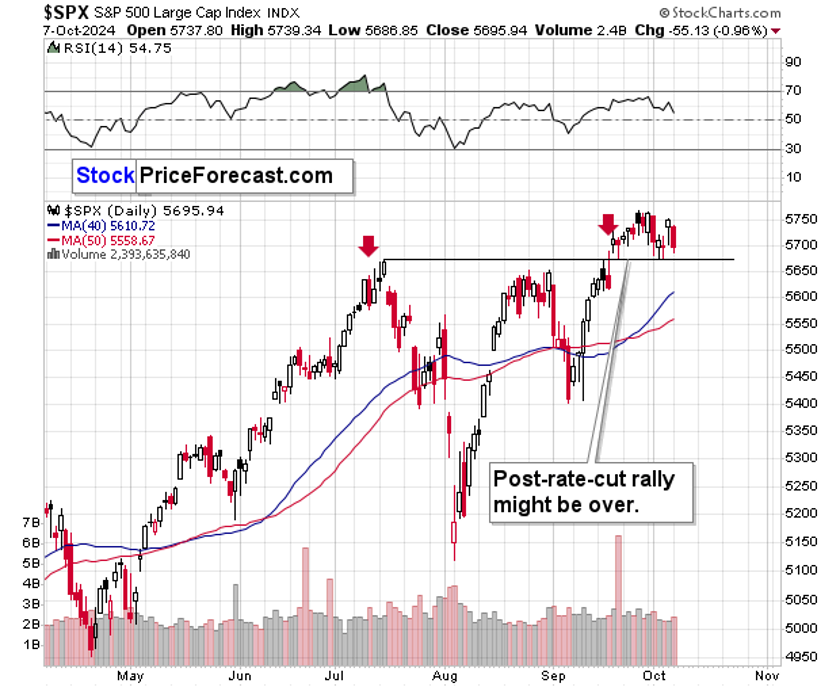
An invalidation of the breakout above the July high would cause severe technical damage, and the odds are that we’re going to see it.
Remember when I commented on the Hong Kong stock index (HSE)?
I wrote that it was likely to decline as it rallied on a huge volume and approached its previous high. Since that time, it corrected, moved even slightly above those highs and…
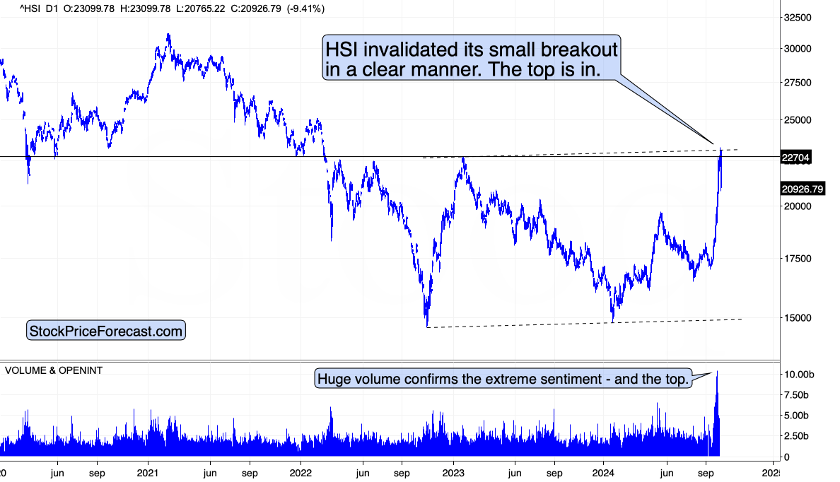
And it just collapsed, by declining over 9% in just one day. The invalidations are clear and it’s a powerful sell sign for those that still remain on the market.
Sure, it’s HSE and not S&P 500, but since all markets are connected in one way or another, this doesn’t bode well for other stocks.
Gold at risk of further decline
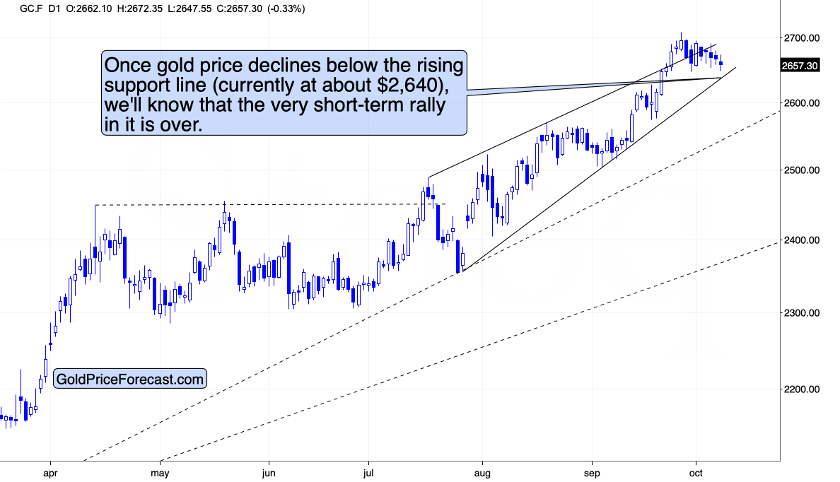
Gold futures are moving lower today, but not – yet – significantly so.
The rising short-term support line is less than $20 away – at about $2,640. A breakdown below this line would clearly confirm that the top in gold is in, and that lower – probably much lower – gold prices would be likely.
Don’t get me wrong – the outlook is already bearish but seeing this technical confirmation would make the outlook clearer for more people, that could contribute to the decline – the opposite of what is likely for the USD Index.
Finally, the higher USD Index is bearish for commodities, such as crude oil or copper.
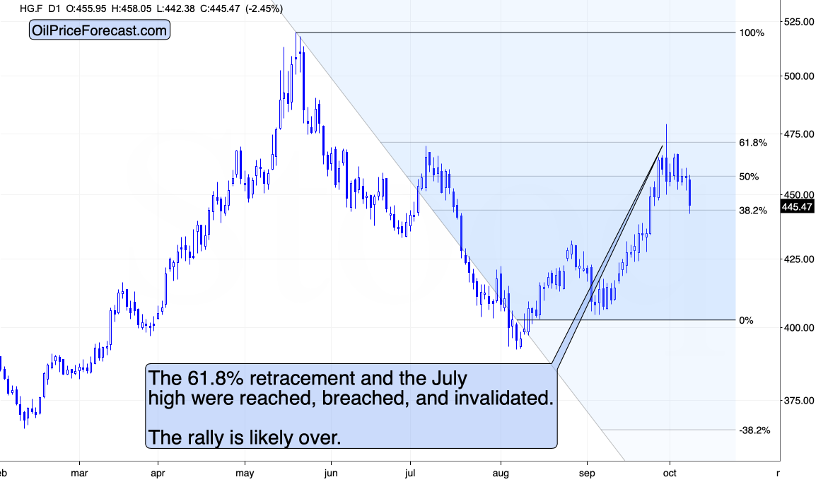
I previously wrote that copper’s invalidation of the move above its July high and the 61.8% Fibonacci retracement was a bearish event and that it likely marked the end of the rally. Given today’s decline in copper prices – that appears to have been the case.
Please note that copper’s reaction to USD Index’s strength was delayed – the same is likely the case with the precious metals sector.
Want free follow-ups to the above article and details not available to 99%+ investors? Sign up to our free newsletter today!
All essays, research and information found above represent analyses and opinions of Przemyslaw Radomski, CFA and Sunshine Profits' employees and associates only. As such, it may prove wrong and be a subject to change without notice. Opinions and analyses were based on data available to authors of respective essays at the time of writing. Although the information provided above is based on careful research and sources that are believed to be accurate, Przemyslaw Radomski, CFA and his associates do not guarantee the accuracy or thoroughness of the data or information reported. The opinions published above are neither an offer nor a recommendation to purchase or sell any securities. Mr. Radomski is not a Registered Securities Advisor. By reading Przemyslaw Radomski's, CFA reports you fully agree that he will not be held responsible or liable for any decisions you make regarding any information provided in these reports. Investing, trading and speculation in any financial markets may involve high risk of loss. Przemyslaw Radomski, CFA, Sunshine Profits' employees and affiliates as well as members of their families may have a short or long position in any securities, including those mentioned in any of the reports or essays, and may make additional purchases and/or sales of those securities without notice.
Recommended Content
Editors’ Picks
EUR/USD extends recovery beyond 1.0400 amid Wall Street's turnaround
EUR/USD extends its recovery beyond 1.0400, helped by the better performance of Wall Street and softer-than-anticipated United States PCE inflation. Profit-taking ahead of the winter holidays also takes its toll.

GBP/USD nears 1.2600 on renewed USD weakness
GBP/USD extends its rebound from multi-month lows and approaches 1.2600. The US Dollar stays on the back foot after softer-than-expected PCE inflation data, helping the pair edge higher. Nevertheless, GBP/USD remains on track to end the week in negative territory.

Gold rises above $2,620 as US yields edge lower
Gold extends its daily rebound and trades above $2,620 on Friday. The benchmark 10-year US Treasury bond yield declines toward 4.5% following the PCE inflation data for November, helping XAU/USD stretch higher in the American session.

Bitcoin crashes to $96,000, altcoins bleed: Top trades for sidelined buyers
Bitcoin (BTC) slipped under the $100,000 milestone and touched the $96,000 level briefly on Friday, a sharp decline that has also hit hard prices of other altcoins and particularly meme coins.
Bank of England stays on hold, but a dovish front is building
Bank of England rates were maintained at 4.75% today, in line with expectations. However, the 6-3 vote split sent a moderately dovish signal to markets, prompting some dovish repricing and a weaker pound. We remain more dovish than market pricing for 2025.

Best Forex Brokers with Low Spreads
VERIFIED Low spreads are crucial for reducing trading costs. Explore top Forex brokers offering competitive spreads and high leverage. Compare options for EUR/USD, GBP/USD, USD/JPY, and Gold.