How to try and avoid volatility and experience it at the same time

S2N spotlight
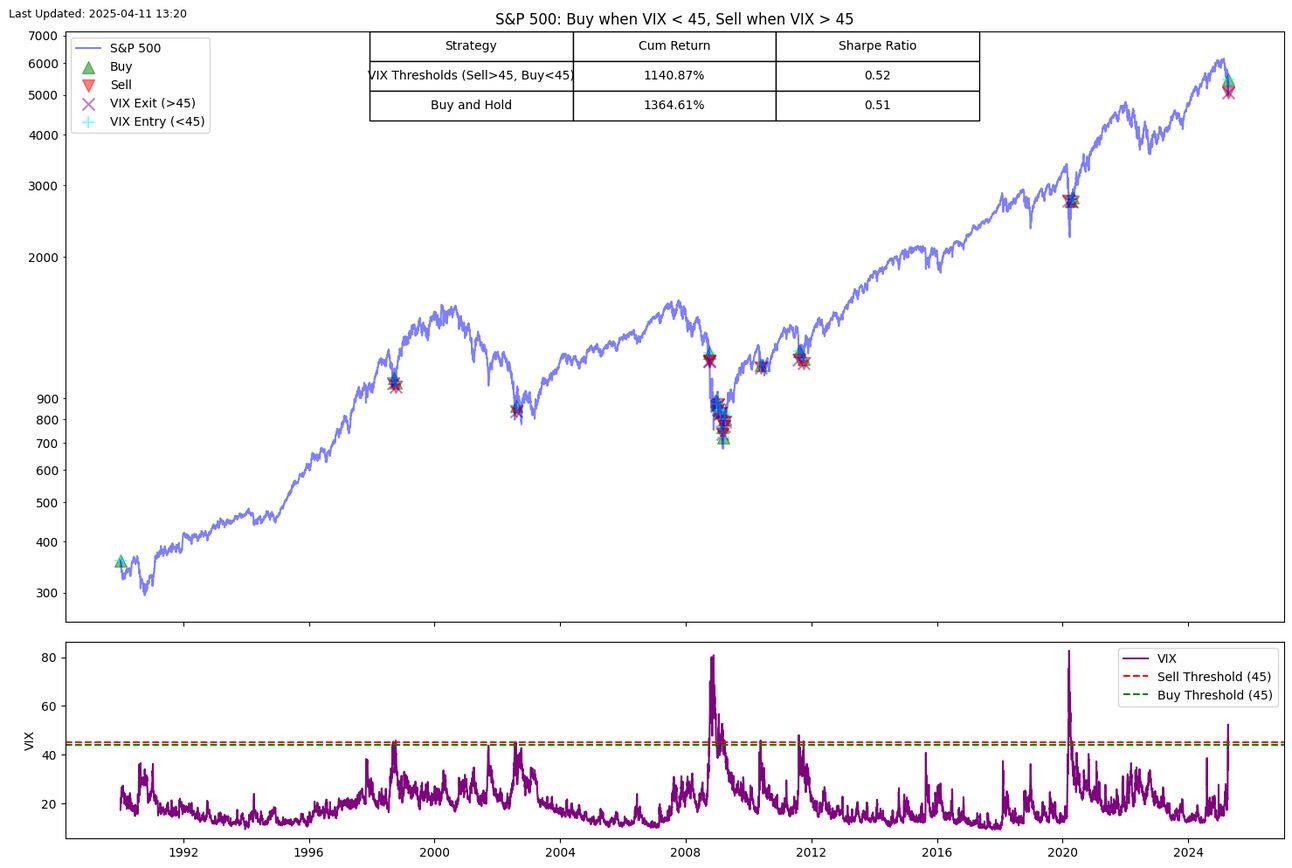
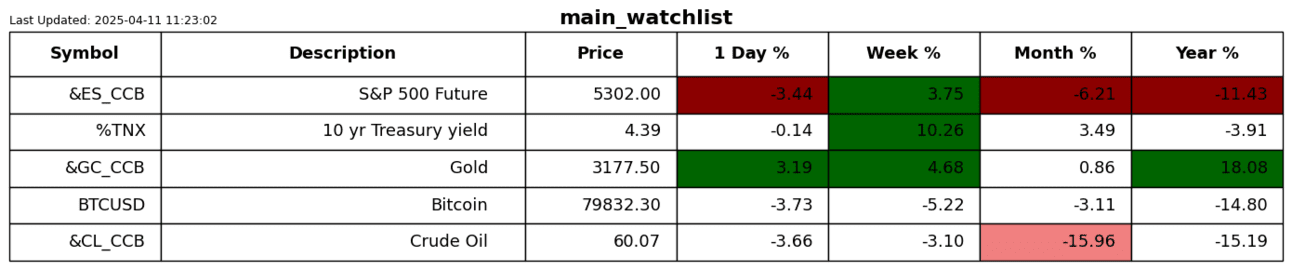
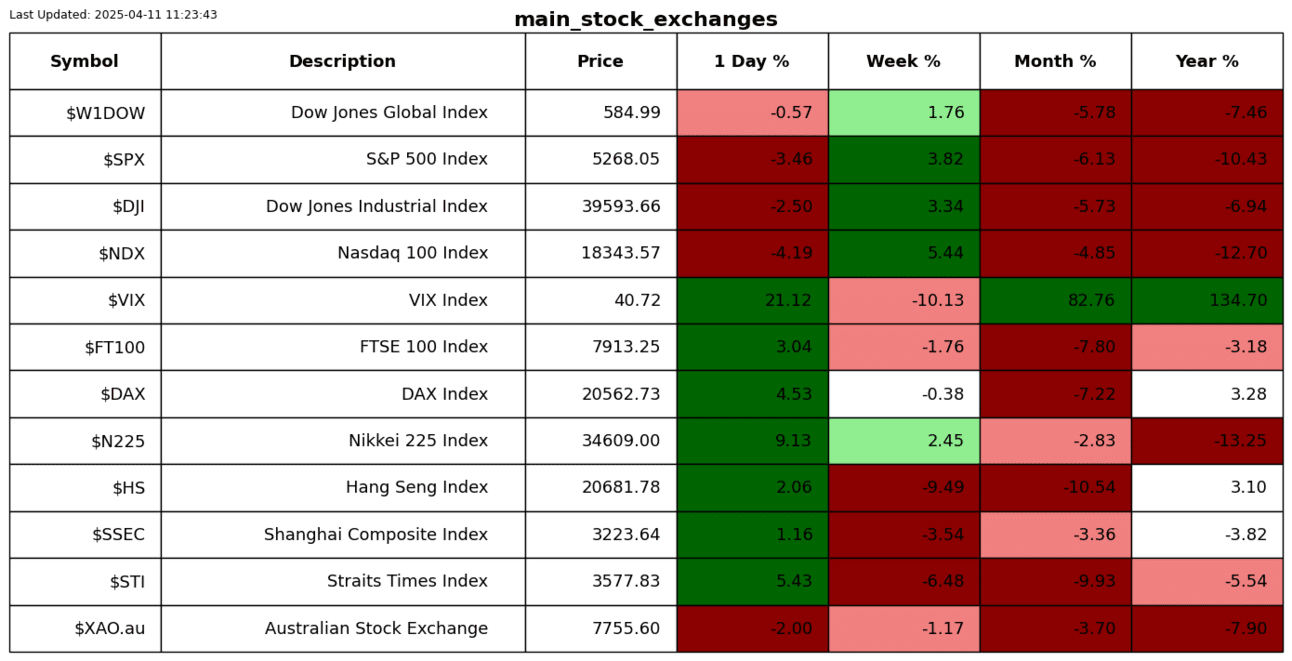
The VIX is spiking more than my sugar levels on a fast day. Shhhh, that is our secret.
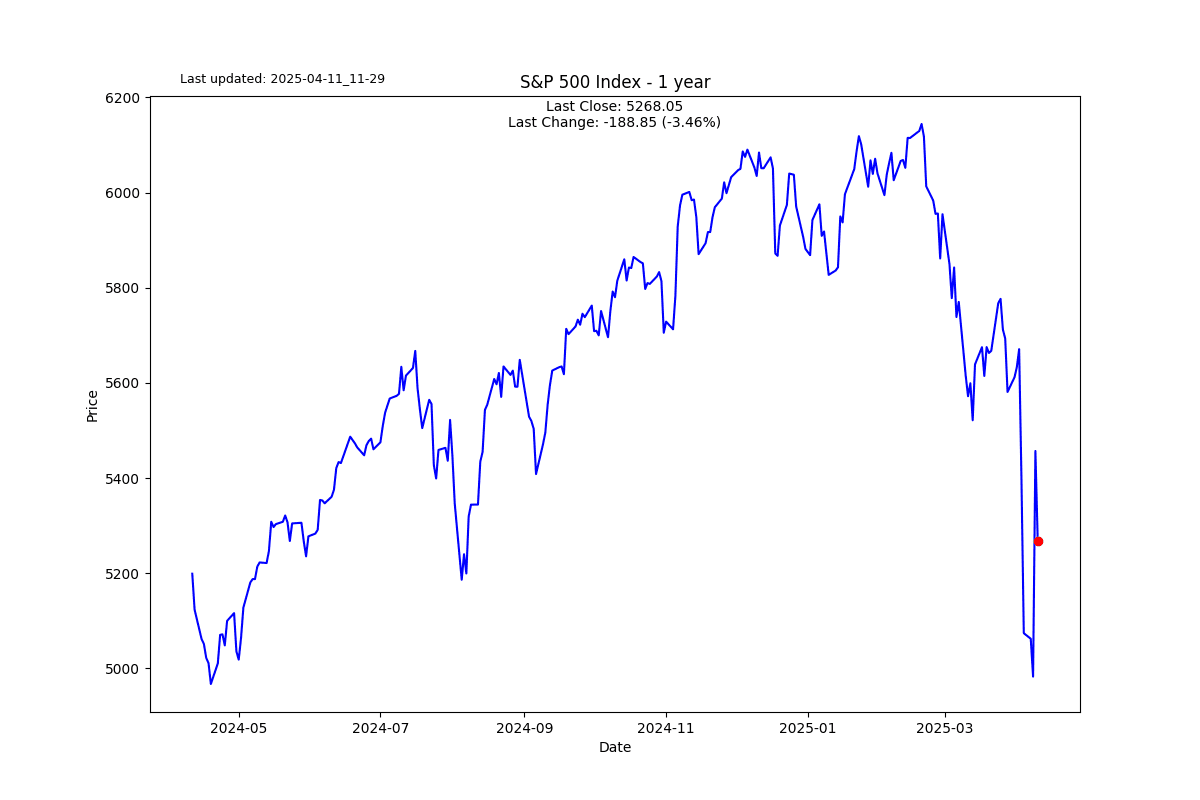
I was thinking to myself today, wouldn’t it be logical to just sit out all this volatility? Definitely sounds logical, so the next question is what level of volatility should be my threshold? I've got you covered. I went through about 100 different combinations of when to exit and when to enter. I am sharing the best combination I could find.
If you sell the S&P 500 when the VIX is over 45 and buy it when it drops below 45, you get a tiny improvement on the Sharpe Ratio but an underperformance on absolute returns. Trust me, I have done the tests; you cannot beat buy and hold using a simple VIX strategy. At best you might get a tiny improvement in risk-adjusted returns.
What I am trying to say in a convoluted way is that the VIX is not a good market timing strategy on its own, as most of the time when the VIX registers a meaningful move, the damage has already been done. In simple language it is a lagging indicator despite the fact that it is based on the future 30 days of expected volatility.
S2N observations
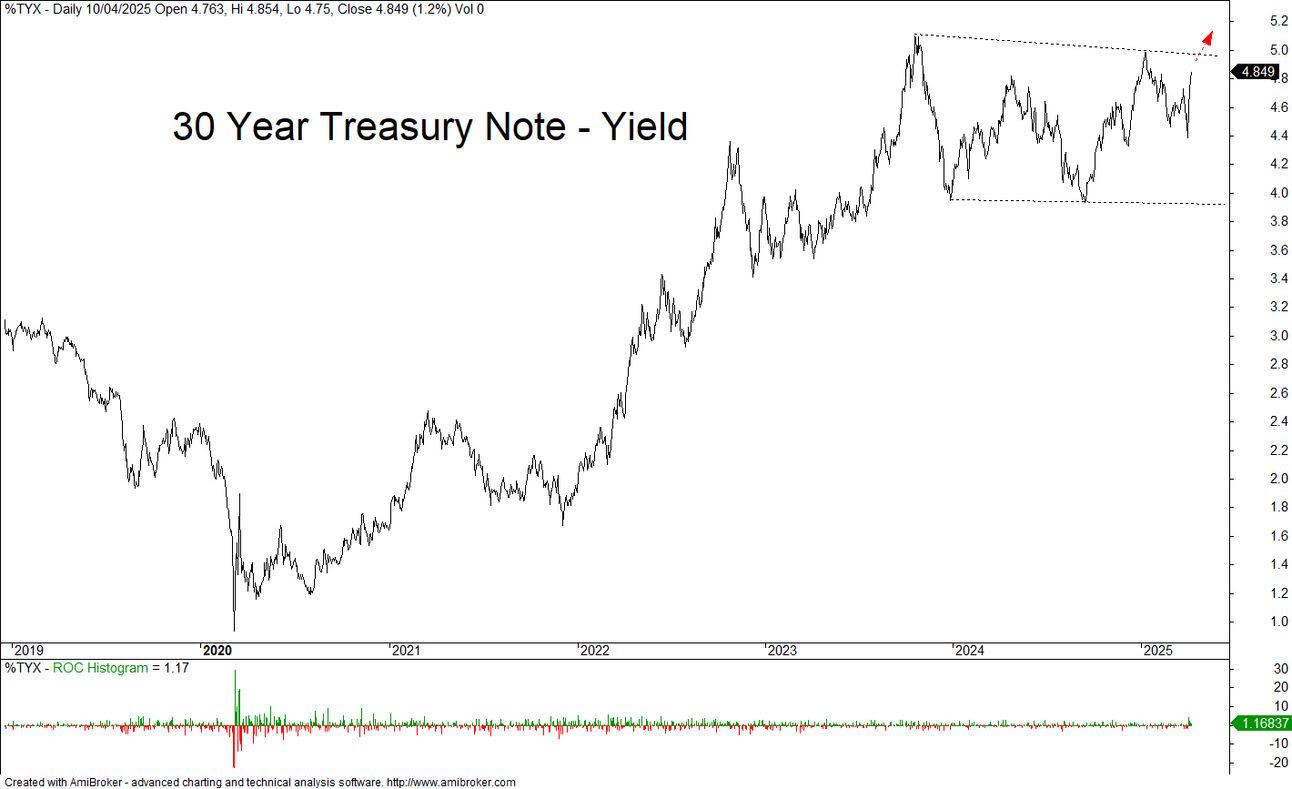
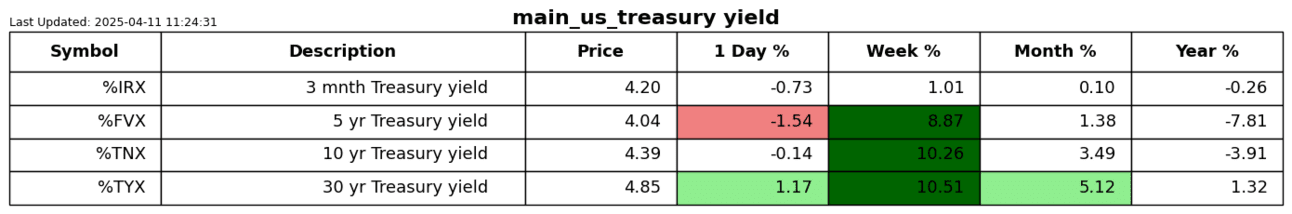
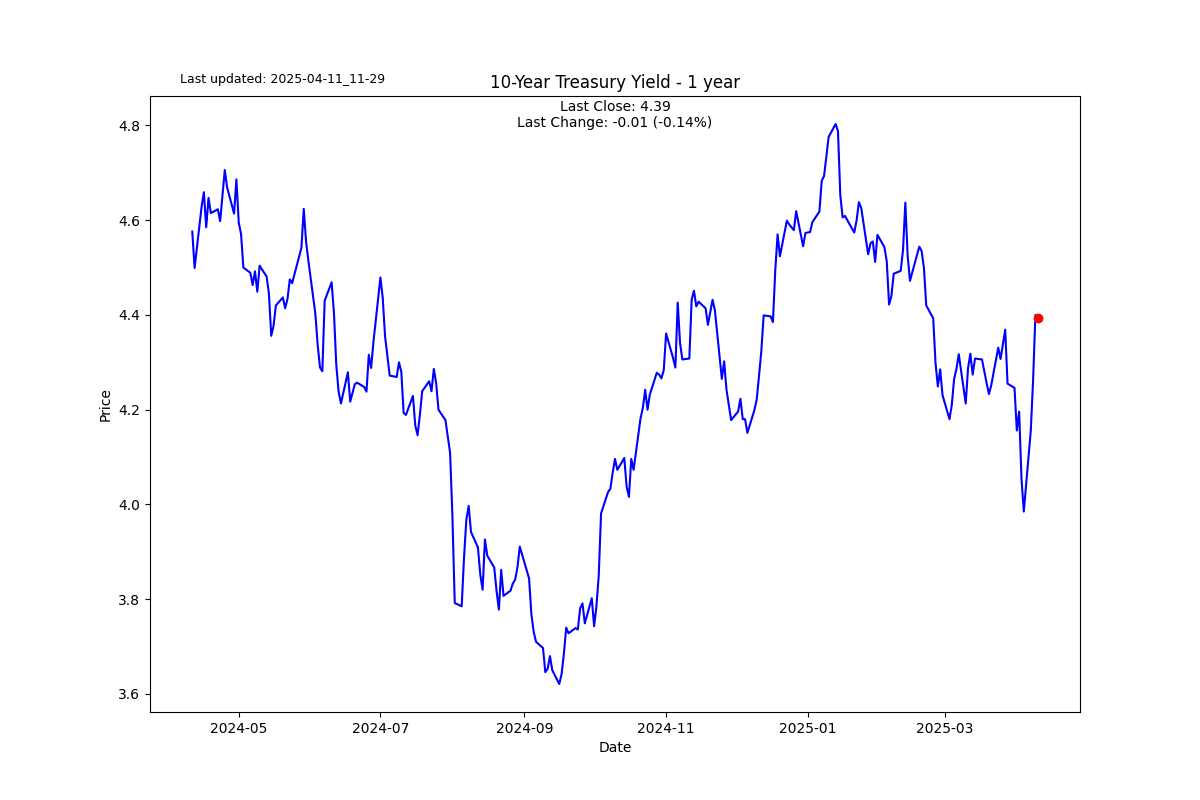
The Treasury Markets are the biggest story at the moment. I cannot unsee the 30-year yield climbing above 5%. We are close, and that will be a major headwind to the US economy. It will also have major global consequences.
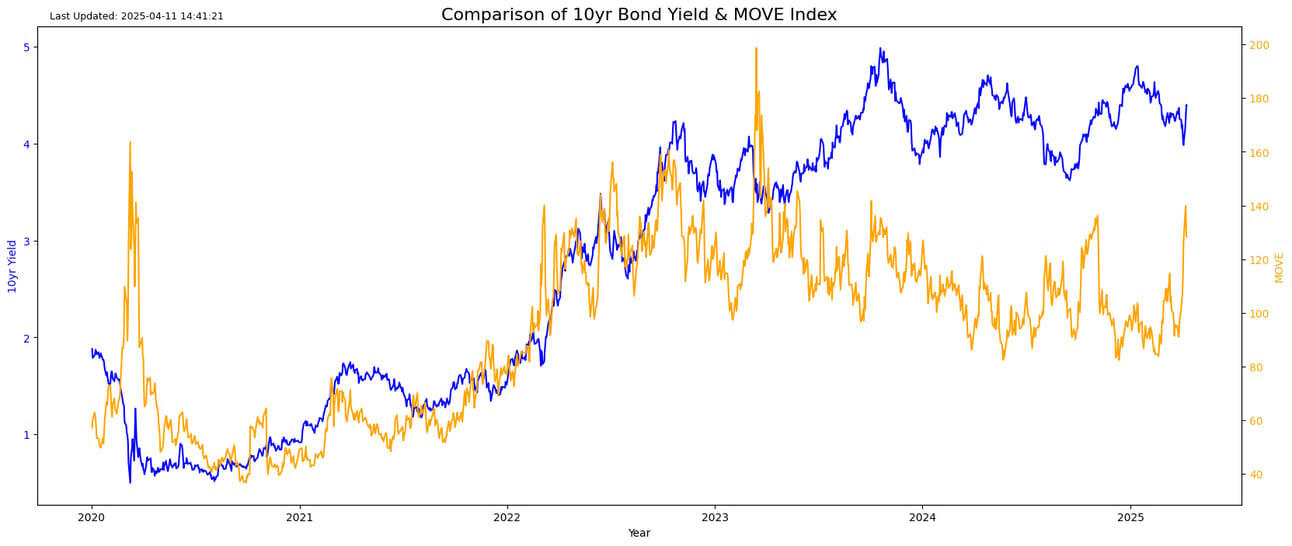
You can see in the chart below the move in the MOVE index, i.e., the bond volatility index.
I thought I would take a peek at the bank account—no, not mine; there isn’t anything to see. I am talking about the treasury general account. I placed the main debt ceiling deadlines over the last few years on the chart below. As you can see, the piggy bank is nearly empty with a looming debt ceiling deadline.
You are probably thinking, What is Bearman up to now?” I am actually not trying to be a scaremongerer; I am just trying to bring to the surface the challenges on the table right now. I honestly admire the energy and fortitude President Trump has to manage so many competing agendas at the same time. I am exhausted just writing this letter.

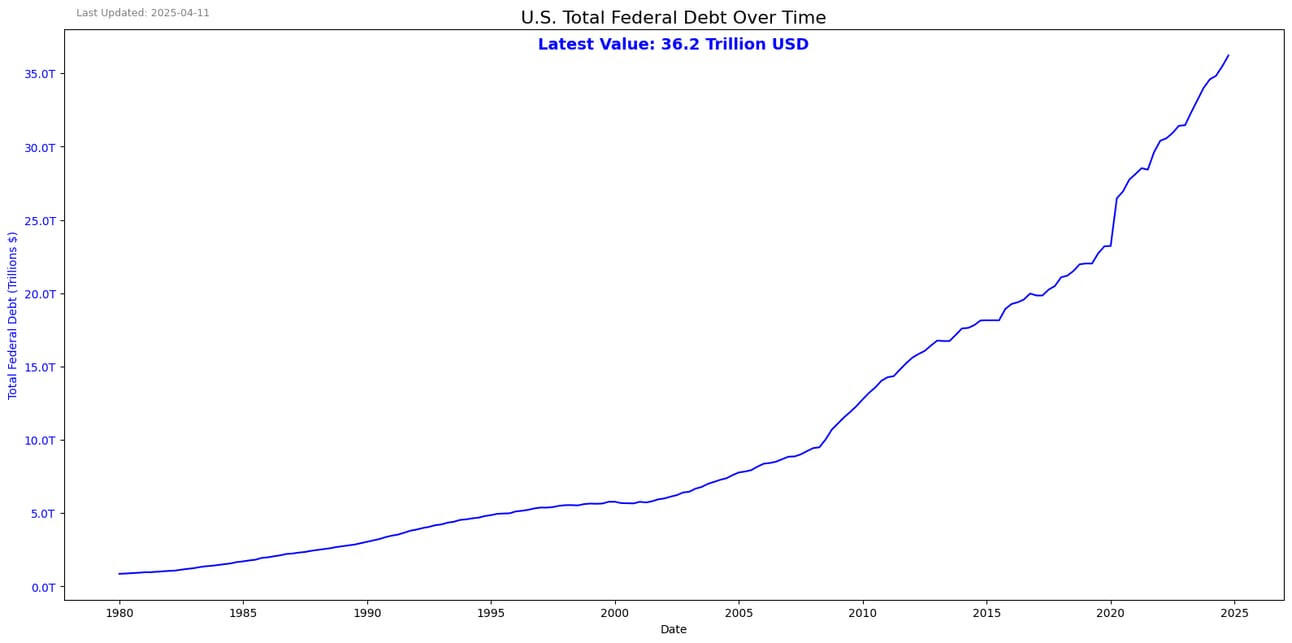
I pulled the latest federal debt from the government website. It is sitting at $36.2 trillion. Apparently the debt ceiling is $36.1 trillion, so we are above it, according to my calculations. Clearly the TGA account is heading towards zero in order to fund the government’s expenses, unless Musk rings the bell with some cash savings. Go DOGE.
The “good” news, if you can call it that, seems to be that Congress is about to sign a deal to lift the debt ceiling by $5 trillion on the back of a promise to reduce the budget deficit over the next 5 years by $4 trillion. I think that is the number.
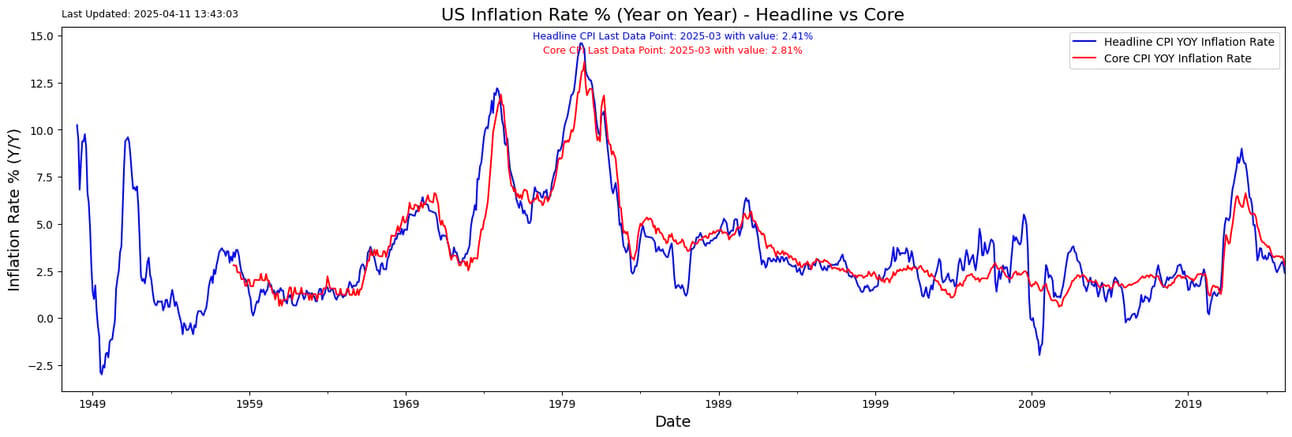
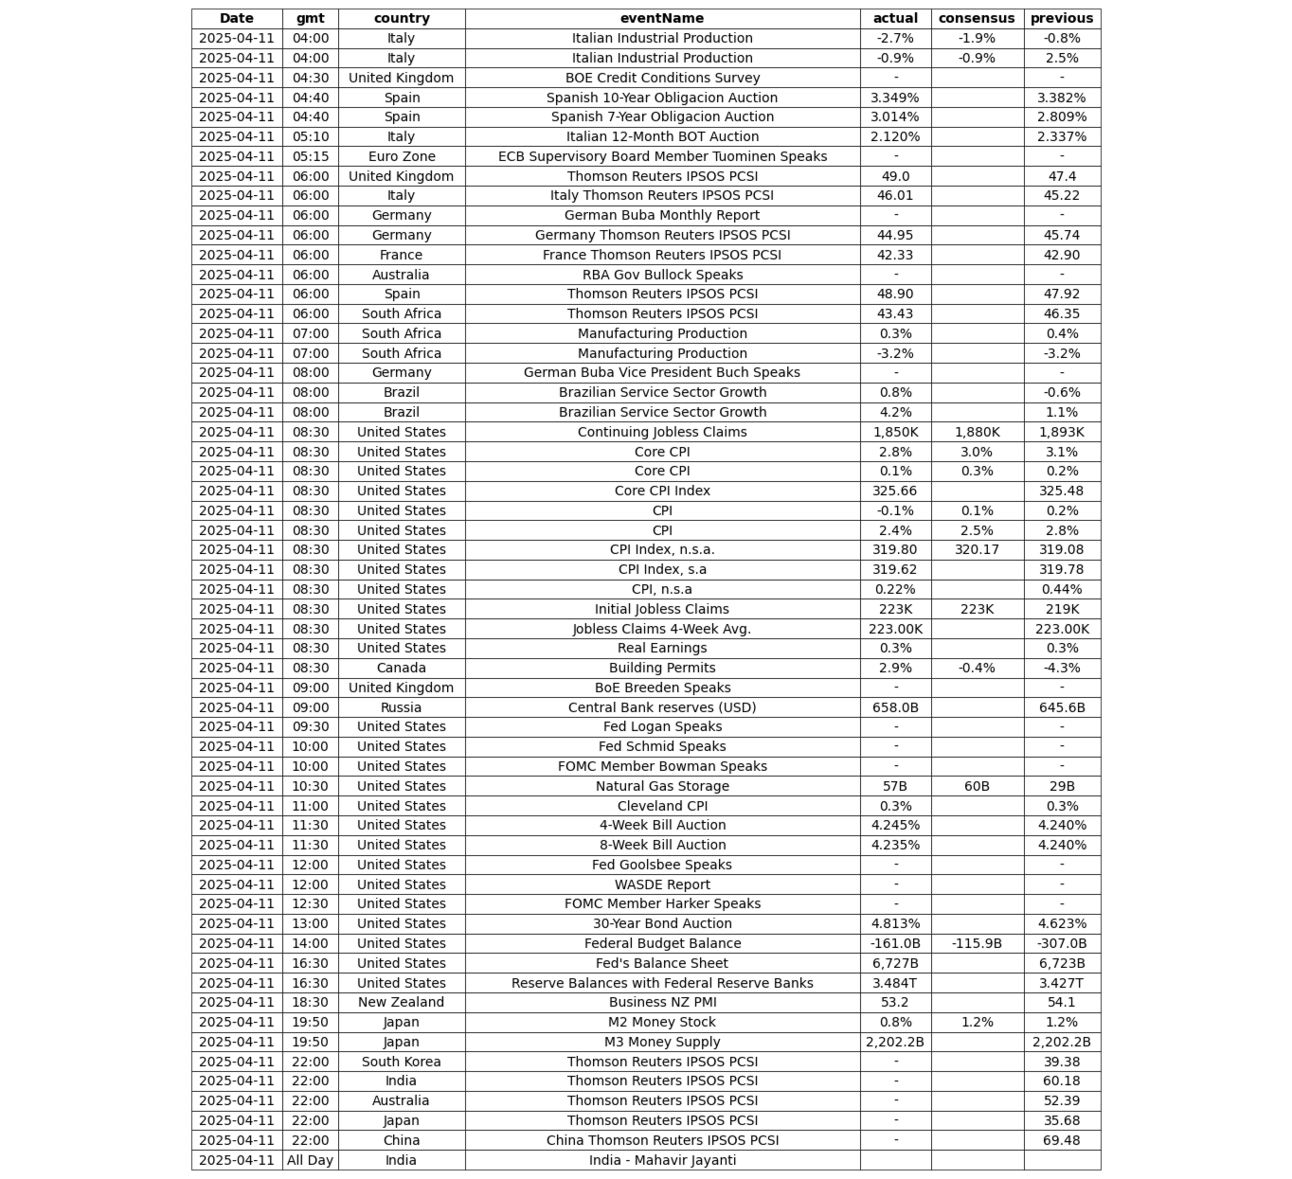
Inflation numbers came in yesterday a bit better than expected. You can see the numbers despite the good inflation numbers; headline and core are around ~2%. Tariff effects are still to pass through, so don’t expect the trend to be heading down anytime soon.
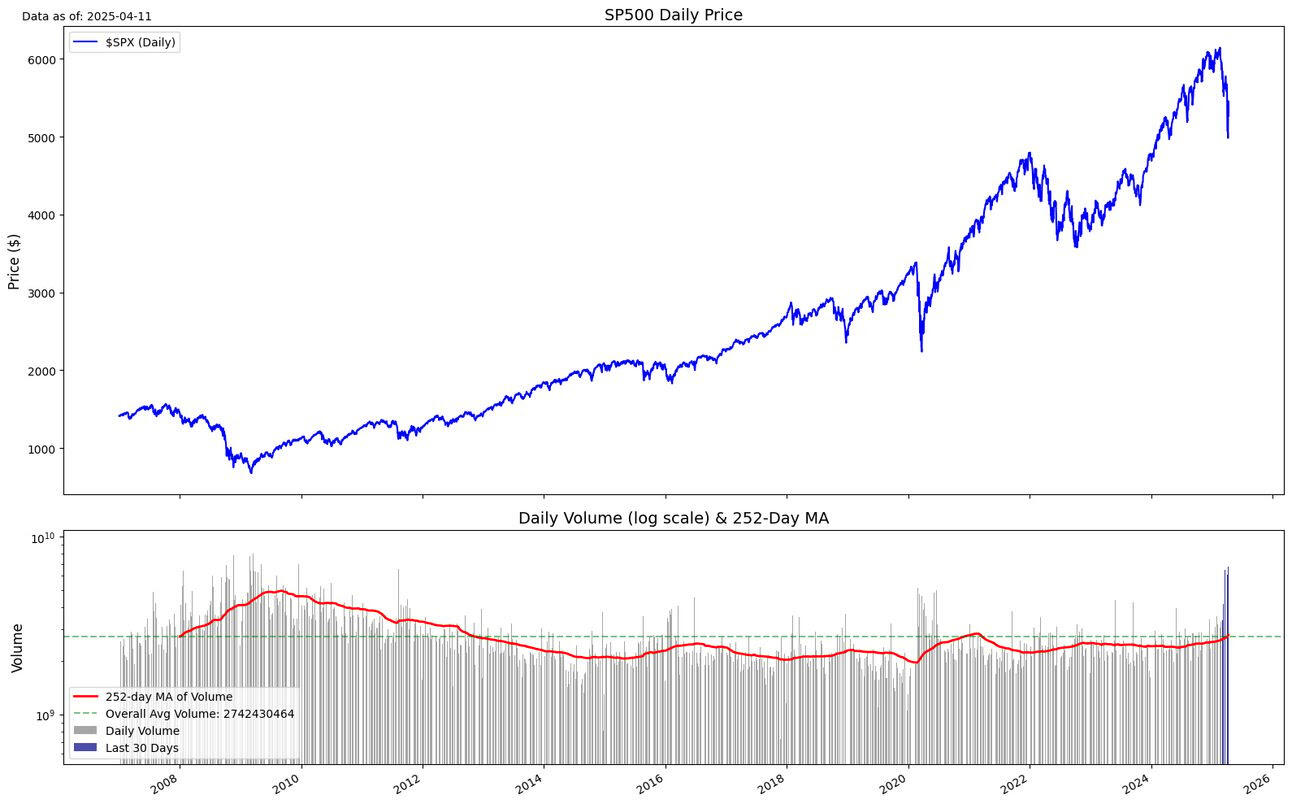
Volume being traded at the moment is very high; we are seeing levels equal to the peak of the global financial crisis in 2008/9.
S2N screener alert
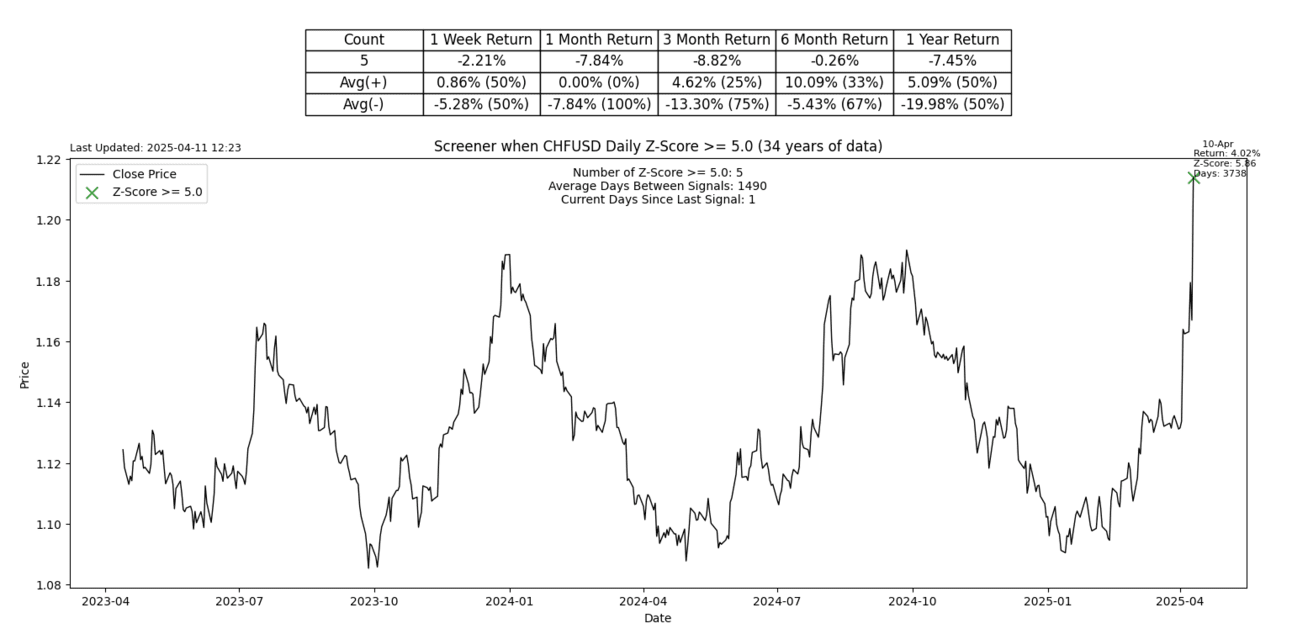
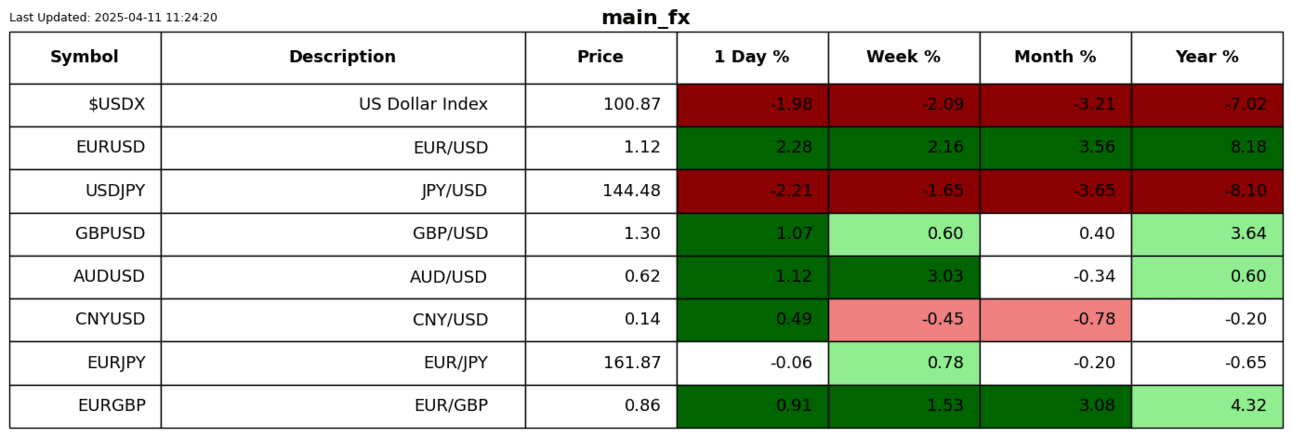
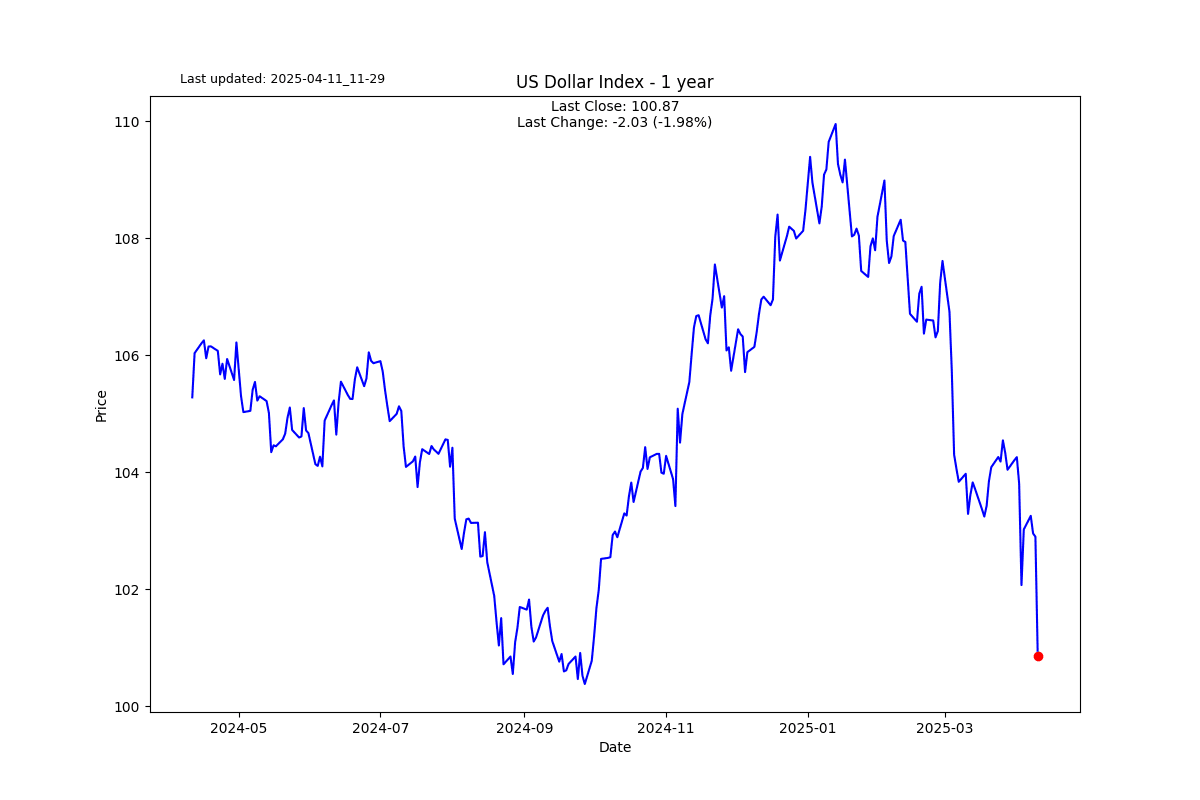
The big move in the FX space is the Swiss franc. It powered ahead against many currencies as a true safe haven. The 5 sigma up move against the dollar is only the 5th in more than 34 years of history, so this is rare.
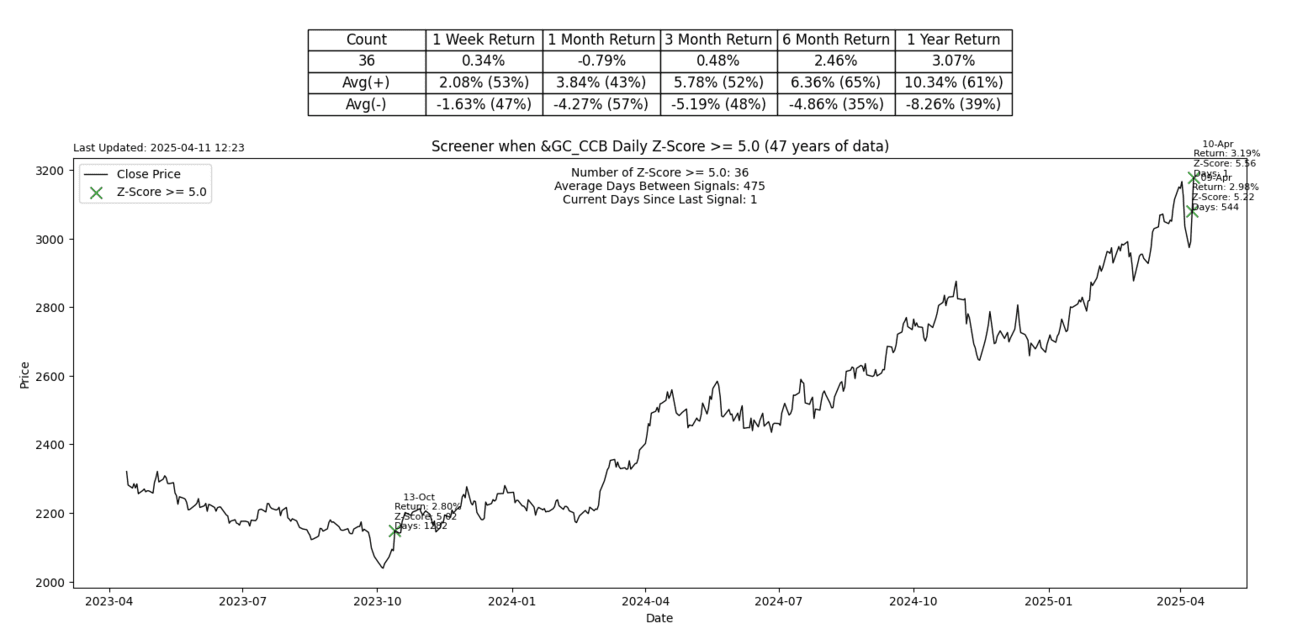
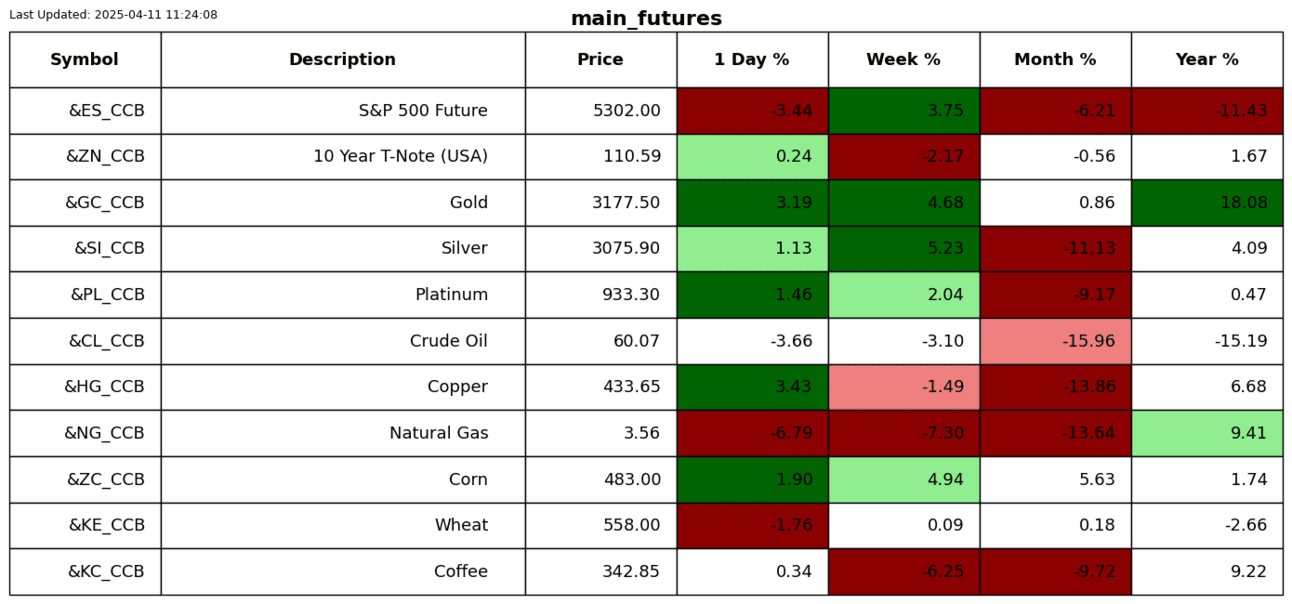
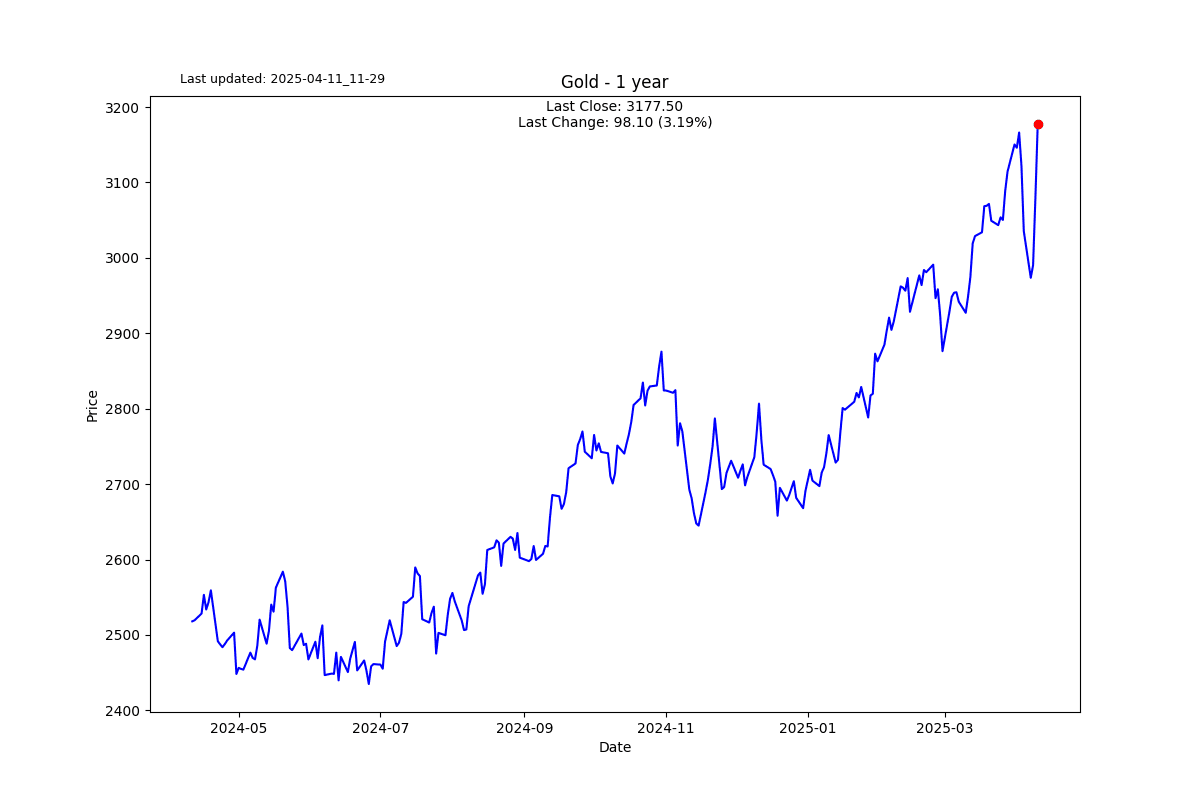
Gold produced another exceptional move, also a 5 sigma event, with a new all-time high.
S2N performance review
S2N chart gallery
S2N news today
Author

Michael Berman, PhD
Signal2Noise (S2N) News
Michael has decades of experience as a professional trader, hedge fund manager and incubator of emerging traders.


