How the Dollar Index helps understand gold price movements
At the turn of the month is when the dollar index tends to reverse. Does it mean something opposite for the precious metals market?
The Dollar's Reversal
All eyes on the USD Index! At least that’s where they should be if one wants to make sense of the recent price moves.
In last Tuesday’s analysis, I wrote the following about the USD Index:
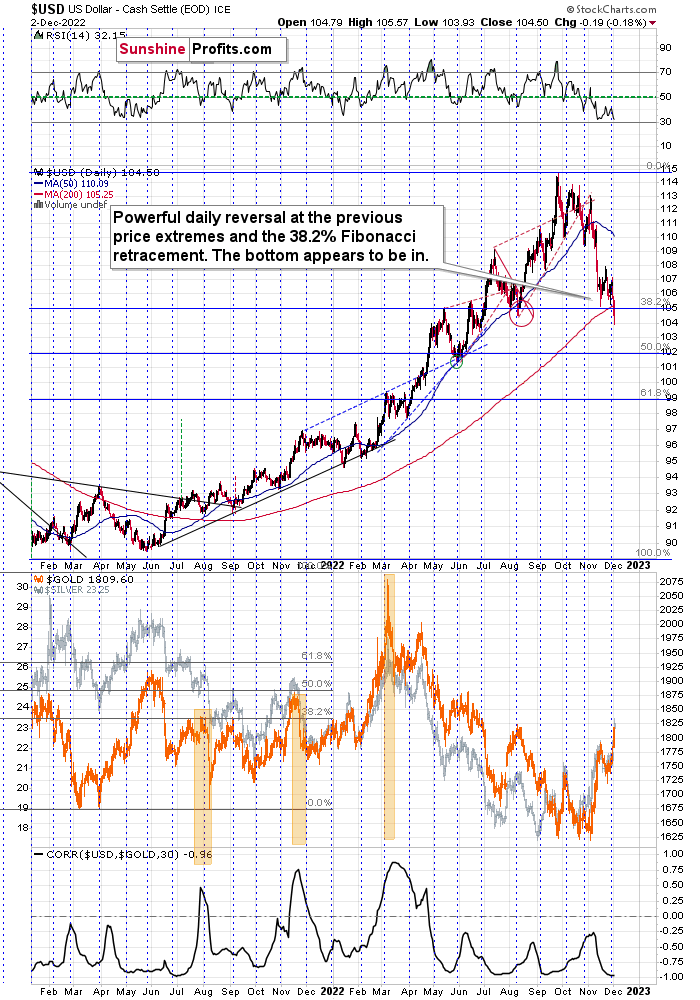
For example, the USD Index could decline to its strong support level at the 38.2% Fibonacci retracement and the August 2022 low as well as the May 2022 high. Such a move would likely imply the RSI at about 30, which would be a crystal-clear signal for many traders that the bottom is in.
To clarify, if that happened, the USD Index would be as oversold from a short-term point of view as it was at its 2021 bottom – when it was trading at about 90.
On Friday, I added:
The USD Index moved slightly below the above-mentioned levels, while the RSI remains just above 30. In other words, the situation is just like it was in mid-2021, with the exception that the prices appear to have moved ahead of themselves.
Now, the move below the support levels is not confirmed, and I doubt that it will be confirmed. An invalidation is a much more likely scenario. Unless we see the breakdown confirmed, nothing really changes.
The USD Index appears to be extremely oversold on irrational behavior, and neither is likely to last. Especially now that it's the turn of the month, when the USD Index tends to reverse. This means that the top in the precious metals market is also likely in or at hand.
Will History Rhyme?
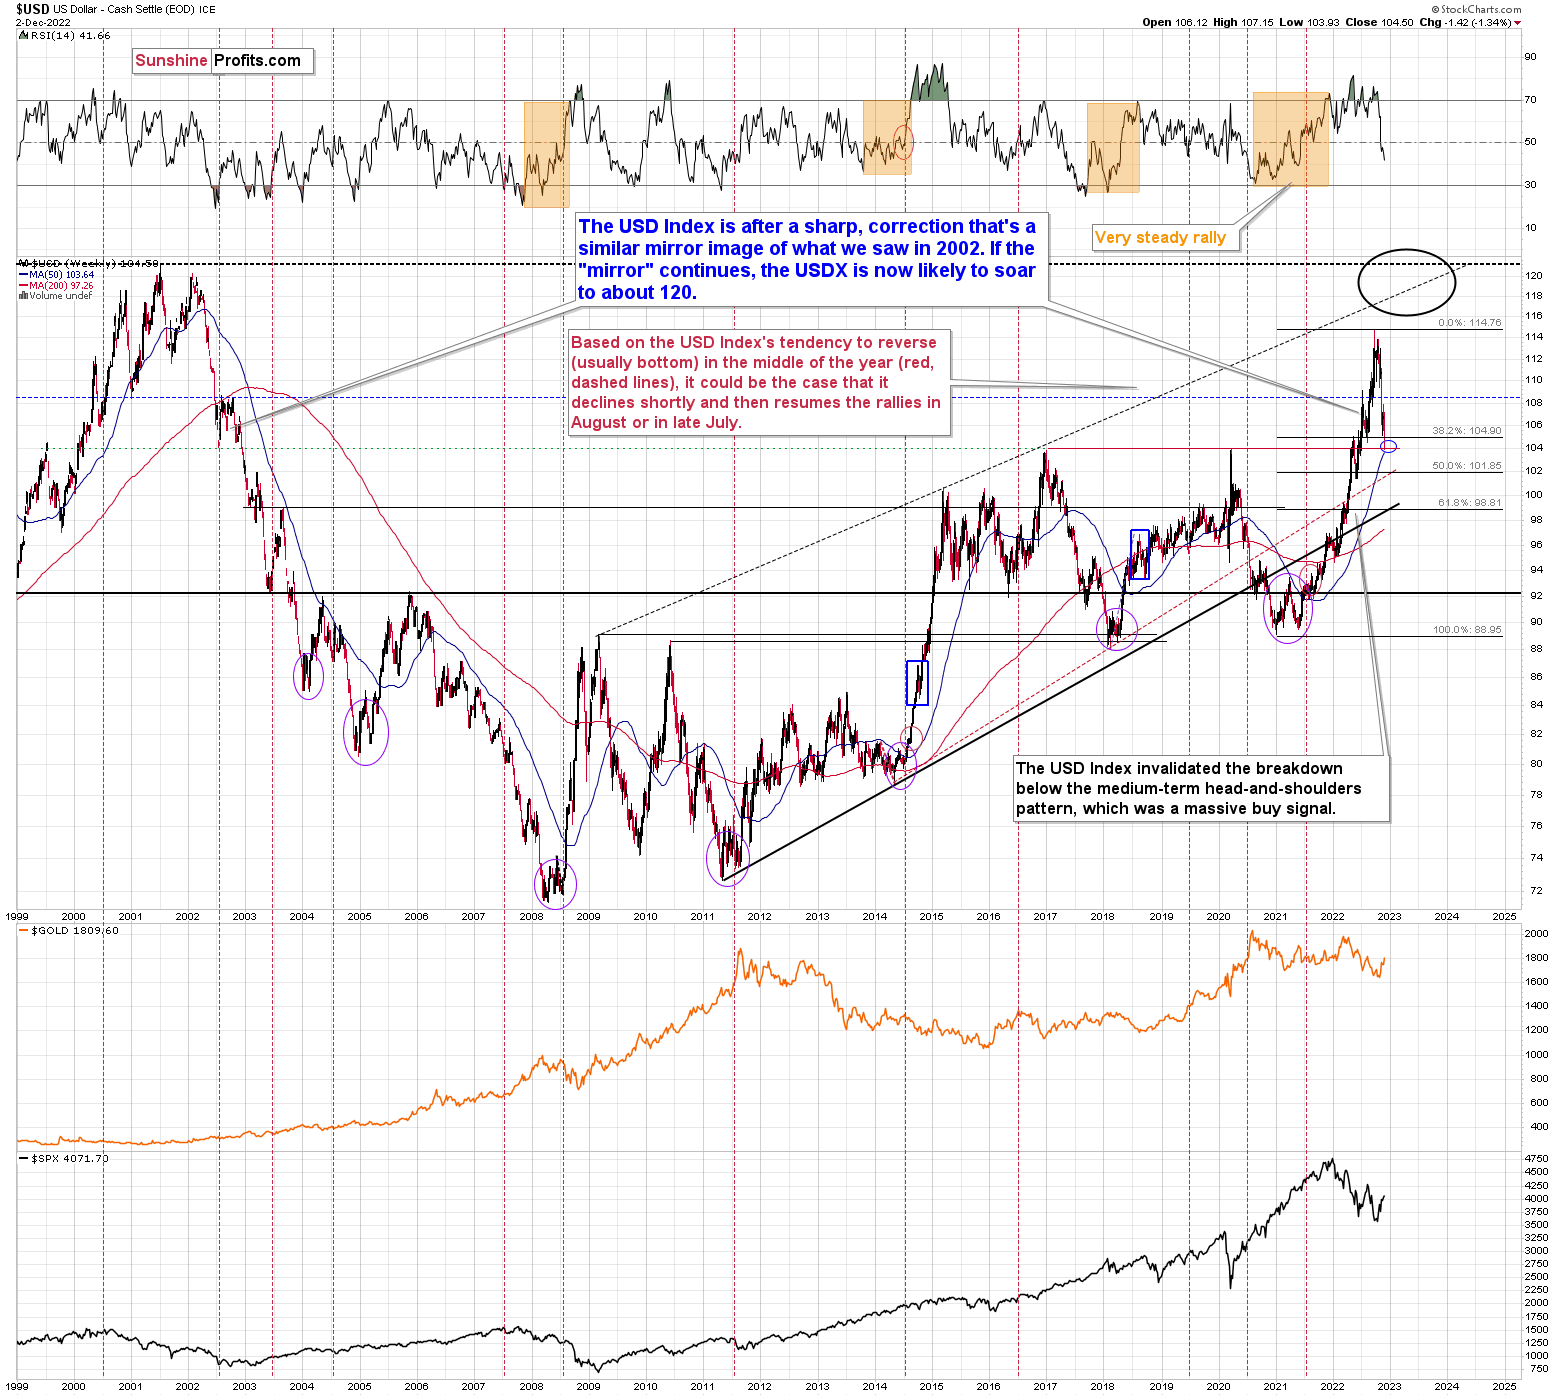
Moreover, please note that there is a yet another, even stronger, support on the above long-term chart.
The 2016 and 2020 tops (as well as the 2002 low and the 1999 top) currently serve as very strong support at about 104 level.
At the moment of writing these words, the USD Index futures’ pre-market low was 104.33 – extremely close to the above-mentioned support.
This might be the most important indication that the bottom in the USD Index is at hand, and the opposite is likely the case for stocks and the precious metals sector.
Friday’s intraday low was 103.93, which means that the above-mentioned very strong support level was reached.
The USDX futures are slightly down in today’s pre-market trading, but it could be the case that the rest of the world (where the exchanges were closed) is reacting to the recent events.
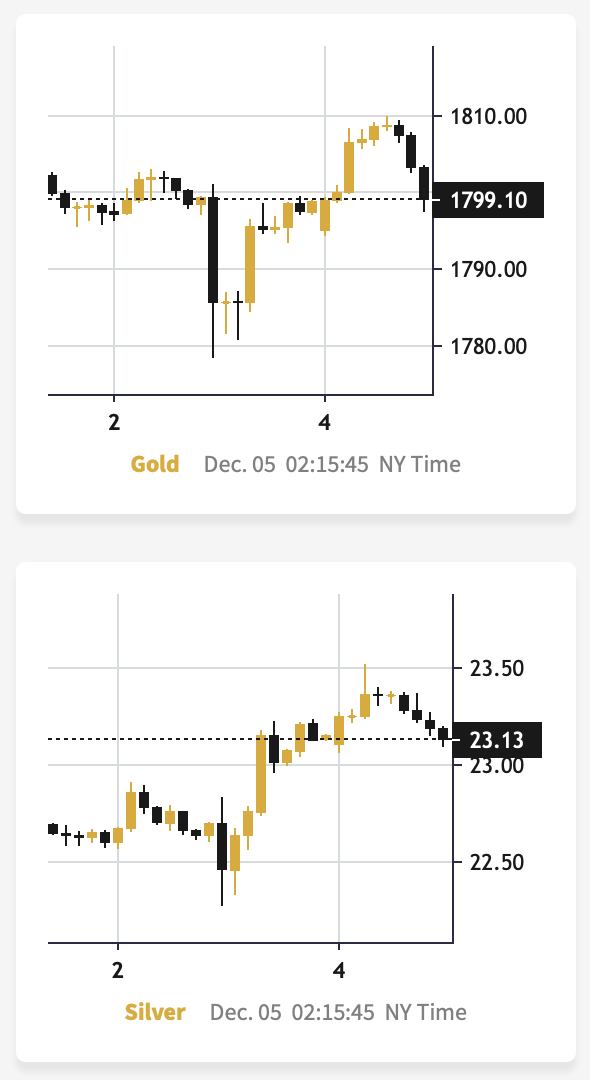
Interestingly, gold and silver moved higher initially, but then they quickly moved back down. In fact, at the moment of writing these words, gold is once again trading below $1,800, and the silver price is on its way to moving back below $23, too.
Anyway, as the 2016 and 2020 tops are reached, the bottoms are likely to be in. It could be the case that the USDX continues to trade around the 104 level for a couple of days before soaring, but a quicker rebound seems more likely to me.
Let’s not forget about the USD Index’s tendency to reverse at the turn of the month. We’re still very close to it, which means that this effect’s bullish implications remain intact.
Exactly the opposite is likely to be the case for the precious metals market.
As you can see on the above chart (when comparing its upper and lower parts), the decline in the USD Index corresponded to the rallies in gold and in the stock market.
And as you can see on the lower part of the first of today’s charts, the correlation between gold and the USD Index has been extremely negative recently.
Consequently, the odds are that the USD Index is about to rally, which is likely to push precious metals prices lower.
Want free follow-ups to the above article and details not available to 99%+ investors? Sign up to our free newsletter today!
Author

Przemyslaw Radomski, CFA
Sunshine Profits
Przemyslaw Radomski, CFA (PR) is a precious metals investor and analyst who takes advantage of the emotionality on the markets, and invites you to do the same. His company, Sunshine Profits, publishes analytical software that any


