|

How our Elliott Wave analysis of Gold nailed the market move

Gold has been one of the most dynamic assets in the markets recently, and getting ahead of its price action is a challenge for most traders. However, our premium members had an edge, thanks to a detailed Elliott Wave analysis that precisely forecasted the pullback and subsequent rally.

Identifying the pullback: Wave four unfolds

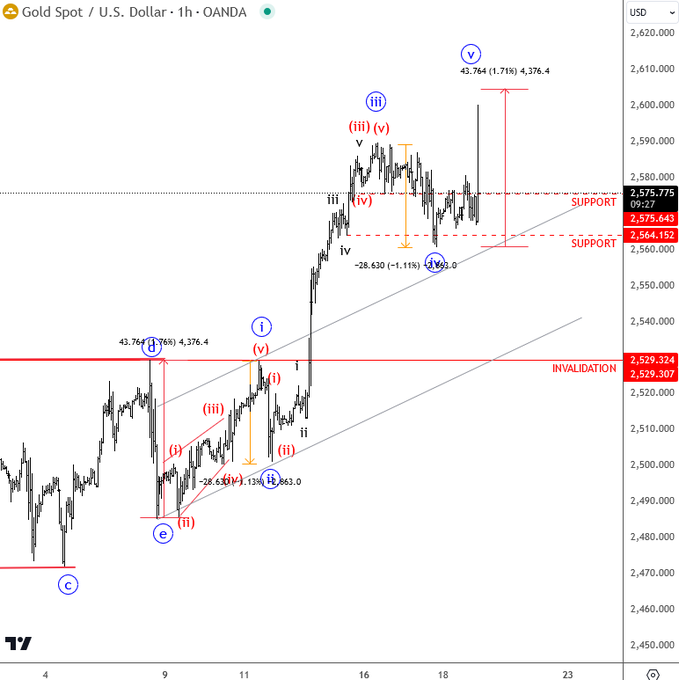
Our analysis started with identifying a potential pullback in gold after the recent swing high. We observed that gold was forming what appeared to be wave four of a larger Elliott Wave structure. This wave was crucial because it often retraces to a certain Fibonacci level, setting up a potential opportunity for the next leg higher.

In this case, the pullback retraced close to the 38.2% Fibonacci level, a common target for wave Four corrections. This alignment gave us high confidence that gold would hold above the 2560 zone, offering a strong support level where buyers could re-enter the market.

Before the Fed

Chart

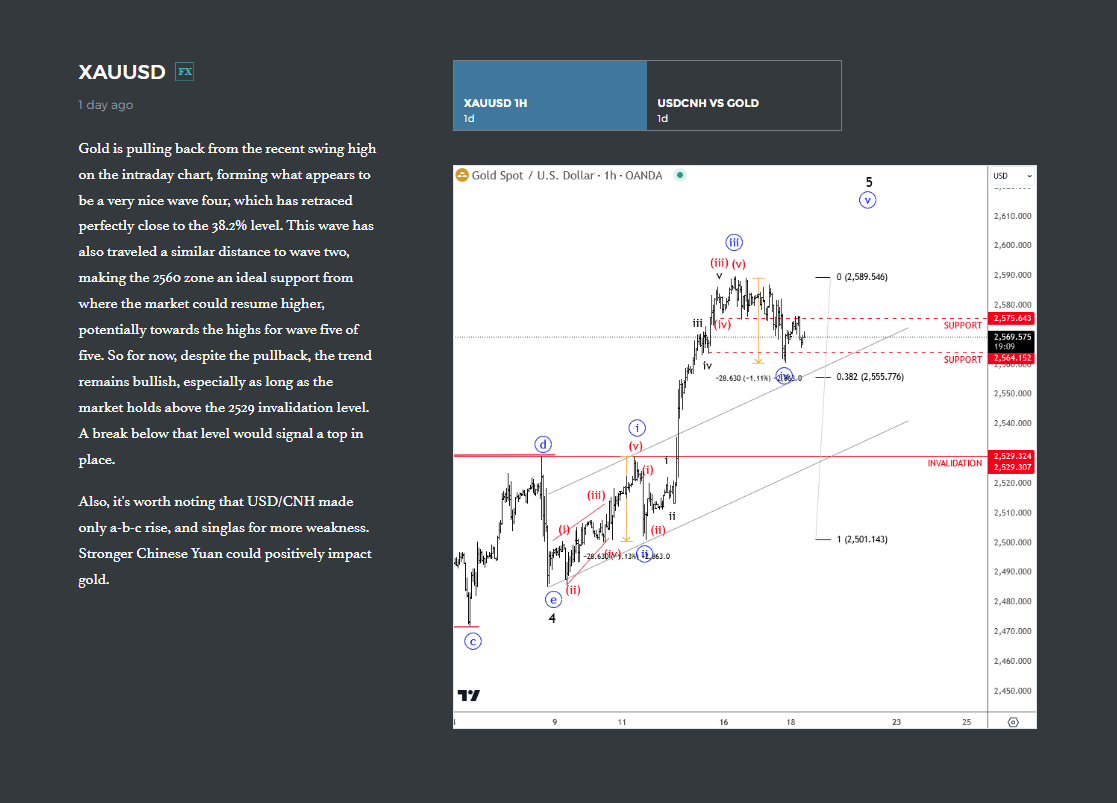
The bounce: Wave five targets higher

Following the pullback, our projection for a Wave Five rally began to take shape. Gold moved exactly as anticipated, holding support at the 2560 zone and continuing its bullish momentum. As long as the market stayed above the 2529 invalidation level, we remained confident that a new high was likely.

Wave Five in Elliott Wave theory typically signals the last leg of the trend, but the question remains; is gold toping out, or did the wave count change?

After the Fed

Chart

Get Full Access To Our Premium Elliott Wave Analysis For 14 Days. Click here.


Get Full Access To Our Premium Elliott Wave Analysis For 14 Days. Click here.

Author

Gregor Horvat

Gregor Horvat

Wavetraders

Experience Grega is based in Slovenia and has been in the Forex market since 2003.

More from Gregor Horvat
Share:

Editor's Picks

EUR/USD recovers further from one-month low set on Friday, eyes mid-1.1800s on weaker USD

The EUR/USD pair is seen building on Friday's late recovery from the 1.1750-1.1740 region, or a nearly one-month trough, and gaining some follow-through positive traction at the start of a new week. The momentum lifts spot prices to the 1.1835 area during the Asian session and is sponsored by a broadly weaker US Dollar.

GBP/USD gathers strength above 1.3500 amid tariff confusion

The GBP/USD pair gains traction to around 1.3520 during the early Asian session on Monday. The US Dollar faces some selling pressure against the Cable as tariff uncertainty lingers. Traders will take more cues from the US Producer Price Index report for January, which will be published later on Friday. 

Gold eyes a daily closing above key 61.8% Fibo resistance

Gold is adding over 1% early Monday, after having gained 2% on Friday. The bright metal scales key technical hurdles, as buyers stay strong amid renewed tariffs and economic uncertainty alongside looming US-Iran geopolitical tensions.

Top Crypto Losers: Zcash, Pump.fun, and LayerZero extended losses as Bitcoin loses $65,000

The cryptocurrency market starts the week in panic mode, with altcoins Zcash, Pump.fun, and LayerZero. Bitcoin falls below $65,000 as the US President Donald Trump regroups amid renewed trade policy risks.

Liberation day take two, the tariff machine just changed gears

Let me caveat this from the outset. What we are watching is first-order mechanics, not the grand macro endgame. This is the market’s immediate reflex to a 15% Trump tariff levy dressed up as judicial drama. The Supreme Court blocked Trump tarrif hammer. The White House came back with a scalpel.

Top Crypto Losers: Zcash, Pump.fun, and LayerZero extended losses as Bitcoin loses $65,000

The cryptocurrency market starts the week in panic mode, with altcoins Zcash, Pump.fun, and LayerZero. Bitcoin falls below $65,000 as the US President Donald Trump regroups amid renewed trade policy risks.