How Nasdaq 10,000 is Possible in Just 1 Year


Everything in life is exponential – or progressive – not linear.
But, just like the earth looks flat when we walk short distances or look to the horizon, most short-term progress looks linear. So do most stock booms and busts, for that matter.
Gain some elevation between you and that horizon, and suddenly the perspective changes.
The exponentiality in stocks becomes perfectly obvious when you take a longer view, and especially when you look at the rare bubble periods, like 1912 to 1942 and presently between 1995 and 2022 ahead.
That’s the thing: Bubbles grow exponentially (progressively), visible even in the short term.
See for yourself…
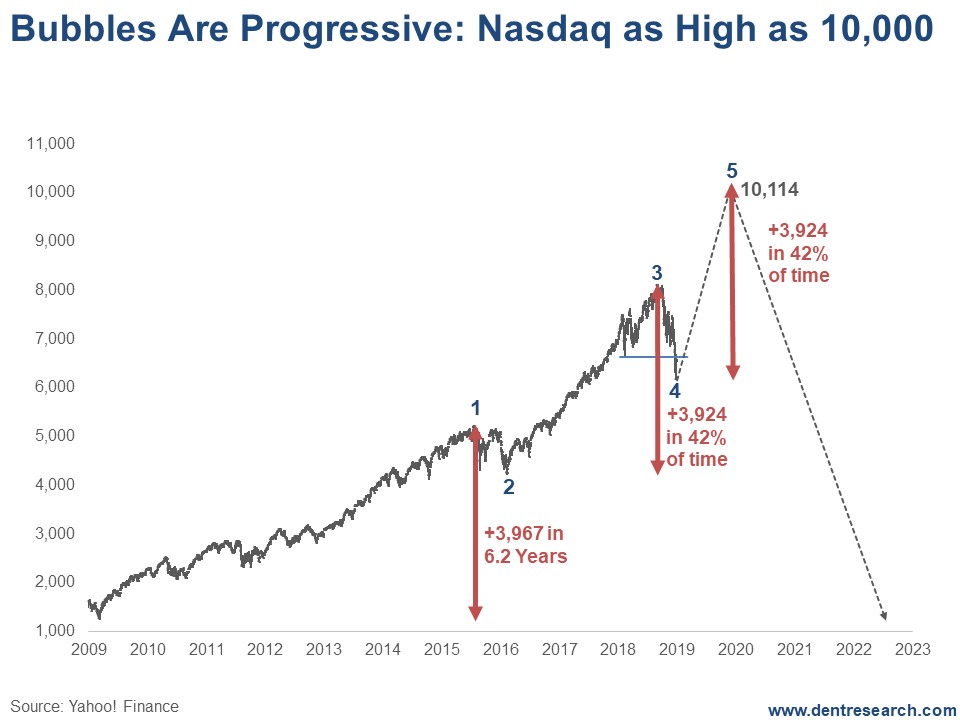
Here’s the best example in the leading bubble index, the Nasdaq since 2009.
If the Dark Window scenario I’m forecasting comes to fruition – that is, stocks see a huge rally in the next several months – it would logically be a sharp, progressive move.
Note that the first wave up on the Nasdaq, from early 2009 into mid-2015, saw a 3,967-point gain in 6.2 years.
More importantly, note that the next wave up saw the same approximate point gain in just 2.6 years (almost 2.5 times faster). There’s that progressive (exponential) move.
That means the next move up could see a 3,924-point gain in 42% of the time, or 1.1 years. So, we could see the Nasdaq break 10,000 by January 2020 because bubbles follow this exponential path. That would be a 63% gain from the December lows.
Who on Wall Street is expecting that?!
If the markets make lower lows ahead, that would reduce the targets. If the Nasdaq falls all the way back to its strongest lower trend-line support at 5,500, I’d only expect the blow-off rally to take the index up to 9,400. Still, that would be a 71% gain from a lower start.
If we have this final blow-off rally, the odds are strongly that it won’t go out with a whimper, or a slight new high, as most bullish Wall Street analysts are predicting.
Instead, it will go out with a bang, bringing the largest one-year and most progressive run we’ve seen thus far.
If the S&P 500 can hold 2,300 in the weeks ahead, this final blow-off or Dark Window rally is even more likely.
If the Nasdaq can hold 5,500, a good bit lower, it’s still a clear possibility.
Author

Harry S. Dent, MBA
Dent Research
Harry S. Dent Jr. studied economics in college in the ’70s, but found it vague and inconclusive. He became so disillusioned by the state of his chosen profession that he turned his back on it.


