How goes inflation?
The last two reports by the Bureau of Labor Statistics have shown promising results: The index of consumer prices (CPI) held steady in May and then edged down by 0.1 percent in June. The lack of inflation reflected by these figures has contributed to the expectation by many analysts that the Fed will begin lowering interest rates, possibly as early as September. Of course, that’s possible, but my own reading of the data leads me to think that that action would be premature. Complicating the analysis is the fact that inflation can be measured in several ways, and not all measures paint the same picture.
Over the years I’ve been an economist, I’ve come to appreciate that the Fed takes pains to speak clearly about its expected course of policy, but always with the caveat that their policy could change as new data about the economy evolve. Their consistently stated goal since their effort to contain inflation has been to bring inflation down to a rate of 2 percent. The precise measure of inflation that would necessarily have to meet this goal, however, has not been specified. Inevitably, the Fed is looking at a host of measures of inflation covering a variety of horizons.
With that orientation in mind, I’ve created the following tables to show price changes of the full CPI as well as the CPI excluding food and energy (CPI x F&E). The latter index is considered to be a measure of “core inflation,” because it purges the CPI of two of its more volatile sectors. The followings show percentage changes of these two indices over three different time horizons, each seeming to reflect different stories.
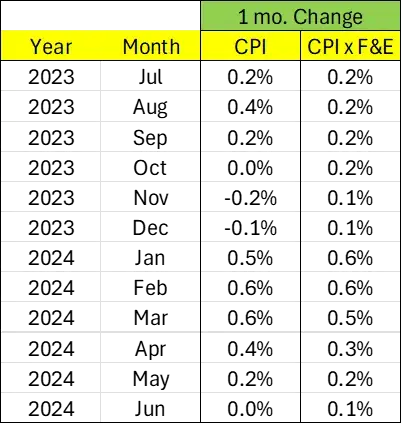
The first looks at month-over month percent changes. The latest one-month percentage changes posted during the second quarter of this year were certainly welcome, but it remains an open question as to whether comparable results or further declines will be posted in coming months. We ended 2023 with these two indices posting changes of -0.1 percent and +0.1 percent, respectively. Subsequently, however, inflation accelerated a bit in the first quarter of 2024 before falling back again in the second quarter.
Table one: One-month changes
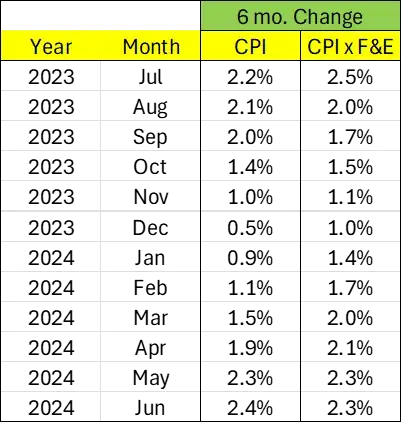
The six-month changes show a slightly different pattern. They, too, moved lower during the latter half of last year, but rather than moving in an up-and-down path during 2024, the six-month price changes have generally been moving monotonically higher — not consistent with the assessment that inflation is still cooling.
Table two: Six-month changes
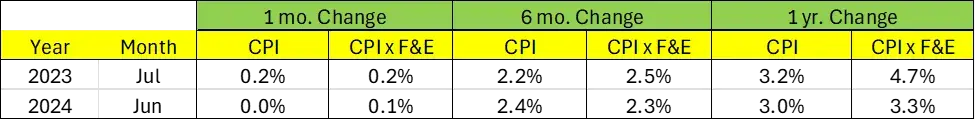
For the one-year price changes, we see very minor improvements in CPI percent changes over the past year but more substantial reductions for CPI x F&E. The improved CPI x F&E numbers may be the most welcome bit of information that the Fed is processing. This improvement notwithstanding, though, year-over-year percent changes for both measures continue to remain above the Fed’s 2 percent target.
Table three: One-year changes

Perhaps the most significant observation I can make considering these data is that, with the exception of the year-over-year change of CPI x F&E, the reported figures for June 2024 don’t seem that different from those posted a year earlier. Undoubtedly, the improvement relating to CPI x F&E with a one-year horizon is welcome news for the Fed, but my sense is that it’s not enough to justify a change in policy by the Fed.
Table four: Year ago comparison
This assessment is fully consistent with what Chairman Powell is advocating when he says, “Our undertaking is to make decisions when and as they need to be made, based on the data, the incoming data, the evolving outlook and the balance of risks, and not in consideration of other factors, and that would include political factors.” It seems clear that the Fed isn’t ready to institute lower interest rates just yet; and given the data we’ve seen to date, this seems to me to be the right call — for now. Stay tuned.
Author
_XtraSmall.jpg)
Ira Kawaller
Derivatives Litigation Services, LLC
Ira Kawaller is the principal and founder of Derivatives Litigation Services.


