Heavy metal chart fest

Few markets can deliver the caliber of pain the precious metals do to buy-and-hold investors. Despite posting gains on a long enough time horizon, gold and silver tend to make sudden and often irrational price moves after prolonged periods of consolidation. As a result, long-term investors frequently miss the boat when it finally sails because they grow bored or cannot justify the opportunity cost of holding non-cash flow assets. On the other hand, active traders are often on the wrong foot because precious metals are better buys when they are out of favor than when they are in favor. In other words, there is no easy money in precious metals, and chasing rallies higher is rarely a paying strategy.
Both gold and silver are at an inflection point. Either near-term support holds, and we see substantially higher prices in the coming months, or we see a liquidation causing both metals to take a roughly 10% haircut in short order. At the moment, we are leaning toward the former, but again, there are no free lunches, so caution is abundant.
Gold and silver offer investors an alternative to traditional assets such as stocks, bonds, and real estate. With stocks and property values arguably overpriced, it seems investors have been willing to put money to work in precious metals despite the lack of incentive for investors to look for alternatives. If we finally see cracks in the never-ending asset appreciation, gold and silver might benefit from cash inflows and changes in portfolio allocation.
Similarly, the geopolitical tensions that triggered last month’s metals rally exist today despite the pullback in gold and silver. Thus, a fundamental price floor should exist while events unfold. We have mapped out near-term support levels in both metals; we will get to those shortly.
In the meantime, we want to remind readers that gold and silver holdings don’t pay dividends or interest. As a result, high interest rates have capped the upside potential in both metals. We believe the interest rate market has rounded the corner toward lower yields and higher bond prices. If this is the case, it will be a tailwind for precious metals.
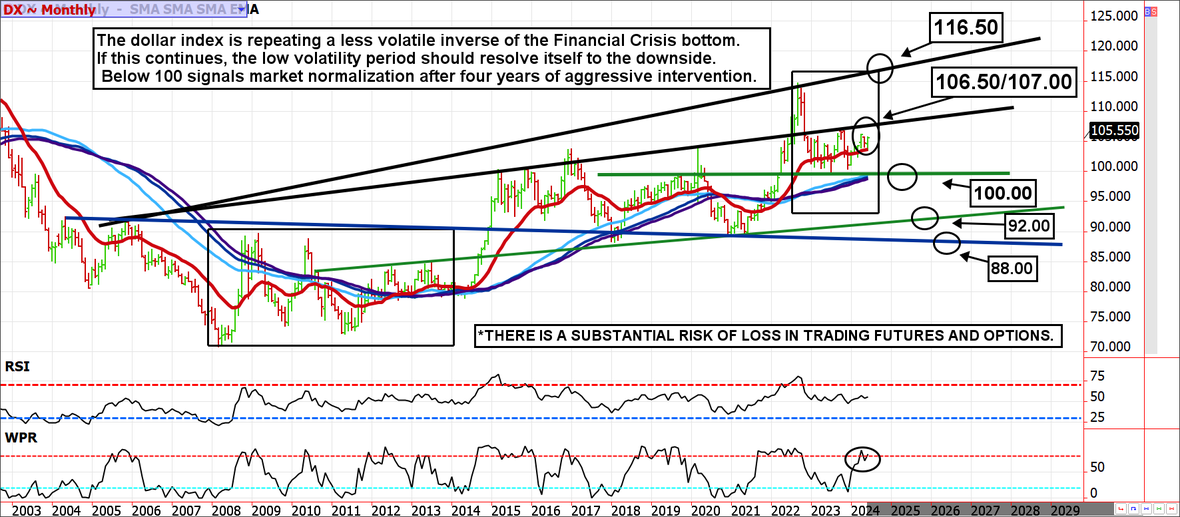
Lastly, the metals markets have put together 2024 rallies without help from the US dollar. The greenback has been hovering at historically lofty levels between 100.00 and 107.00 for almost two years, but eventually, gravity will present itself. The topping process in the dollar is a shorter and less volatile inverse of the Financial Crisis bottom. If the similarity continues (as long as the 107.00 resistance holds), we should see the dollar index return to the 92.00/88.00 area. Of course, this would take months or years, not days or weeks. Either way, it supports the premise of firm metals prices.
Silver charts
There are schools of thought that technical analysis is a waste of time, but sometimes simple lines on a chart work better than they should; perhaps it is a self-fulfilling prophecy. The May silver rally ran out of steam in the mid-$32.00s, a level we have been pointing out on the monthly silver chart for at least a year and a half. It isn’t a coincidence that buying dried up there; I’m sure a lot of chartists had their eyes on it. However, failure at this level doesn’t necessarily mean a top is in, but it does complicate things.
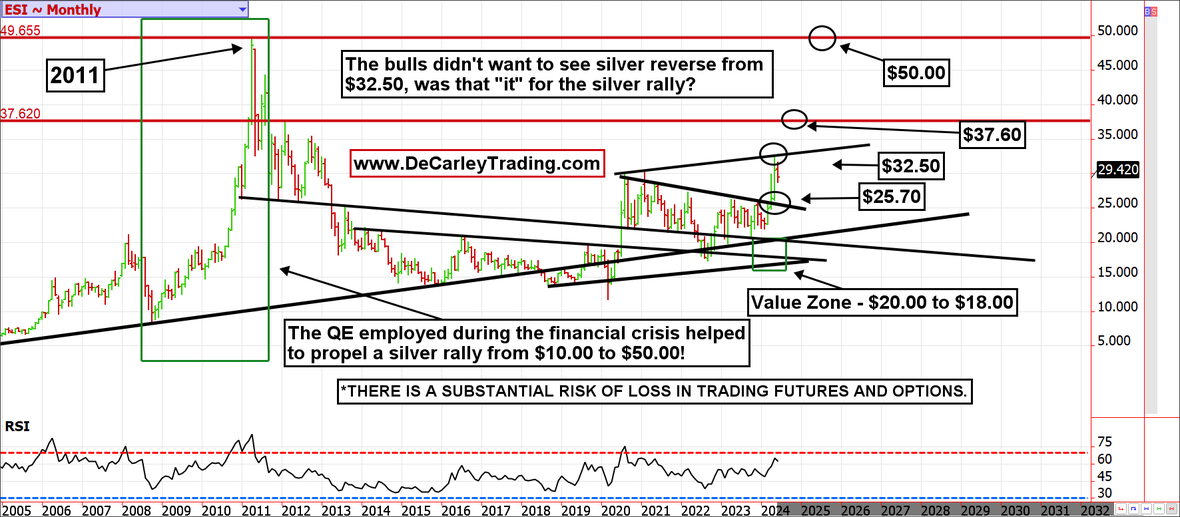
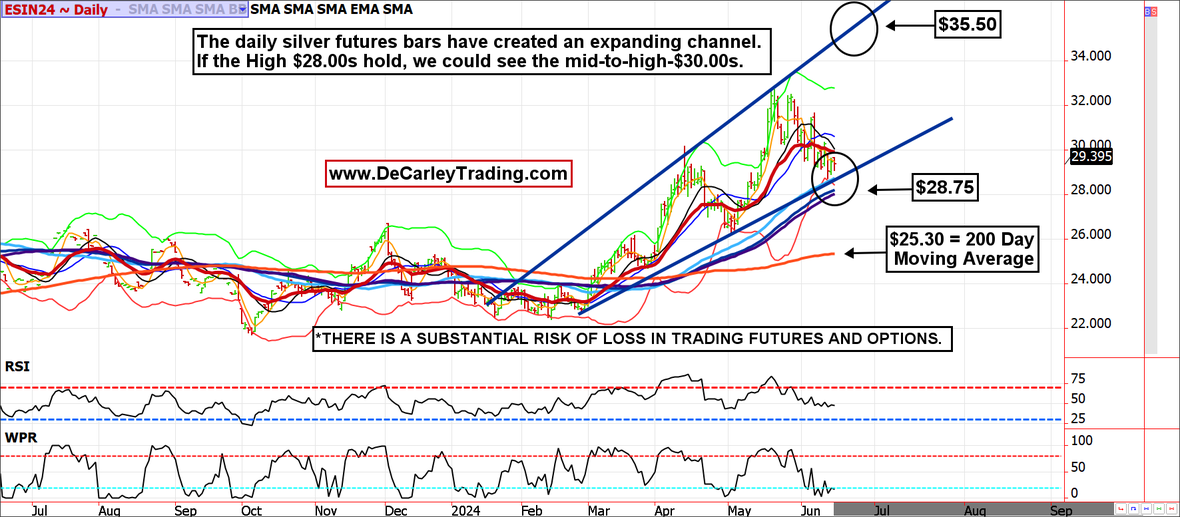
The monthly RSI (Relative Strength Index) never reached extremely overbought values and still points higher. This and the aforementioned fundamental arguments for higher silver led us to believe this is a pullback that will eventually breakout to the high $30.00s. Unfortunately for the bulls, even if we are right, a dip to retest the breakout area near $25.70 is possible. Yet, the daily silver chart suggests that pullback might be limited to the uptrend line near $28.75. It should also be noted that the 200-day simple moving average is currently at $25.30, just under the monthly chart breakout level. The difference between $25.70 and $25.30 is noise in silver, so traders should consider this a band of support rather than an exact science.
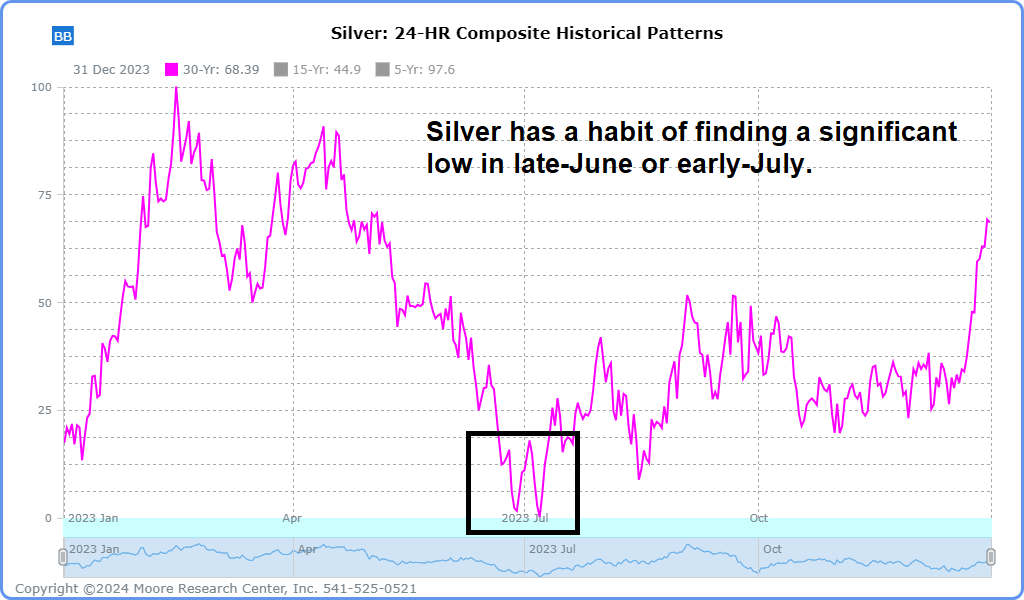
Seasonality supports silver in the coming weeks; silver prices often make a significant low in late June or early July.
Gold charts
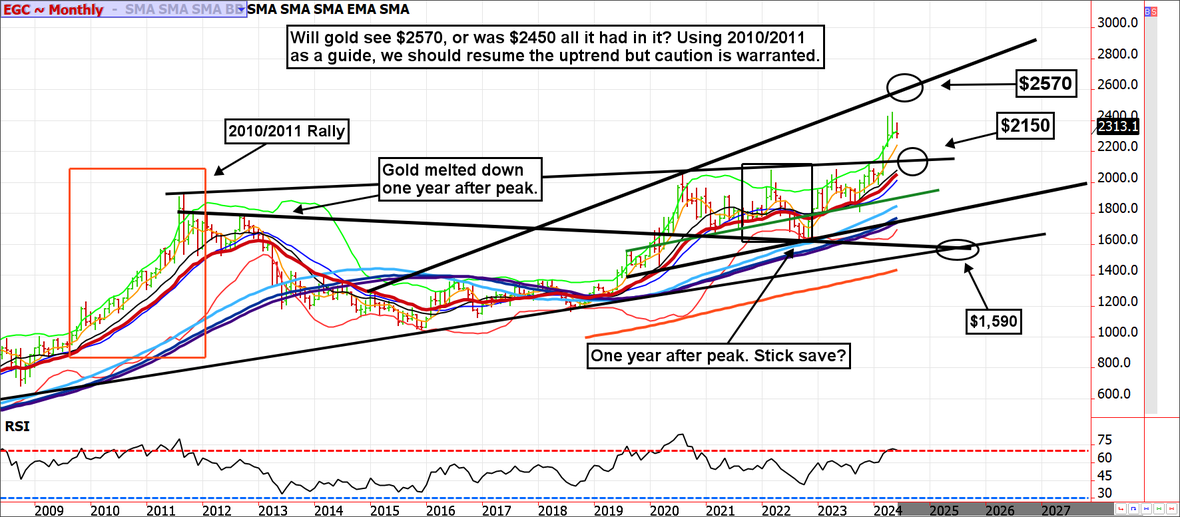
The April and May gold rallies were a bit “extra,” and the moves needed to be digested. While some call this a double top, we aren’t so sure. We believe the monthly chart trendline of just under $2600 is still in play. Once again, precious metals corrections are often treacherous leaving many bulls on the sidelines. The monthly chart suggests the breakout point of $2150 is possible before the rally resumes. That would be difficult for the bulls to stomach. Further, there is divergence in the RSI, suggesting when prices turn south, they will do so in an epic fashion. For this reason, the bulls should be less aggressive in hopes of the next leg higher from here than they might have been a few months ago. Nevertheless, we believe it is a “buy large dips” environment.
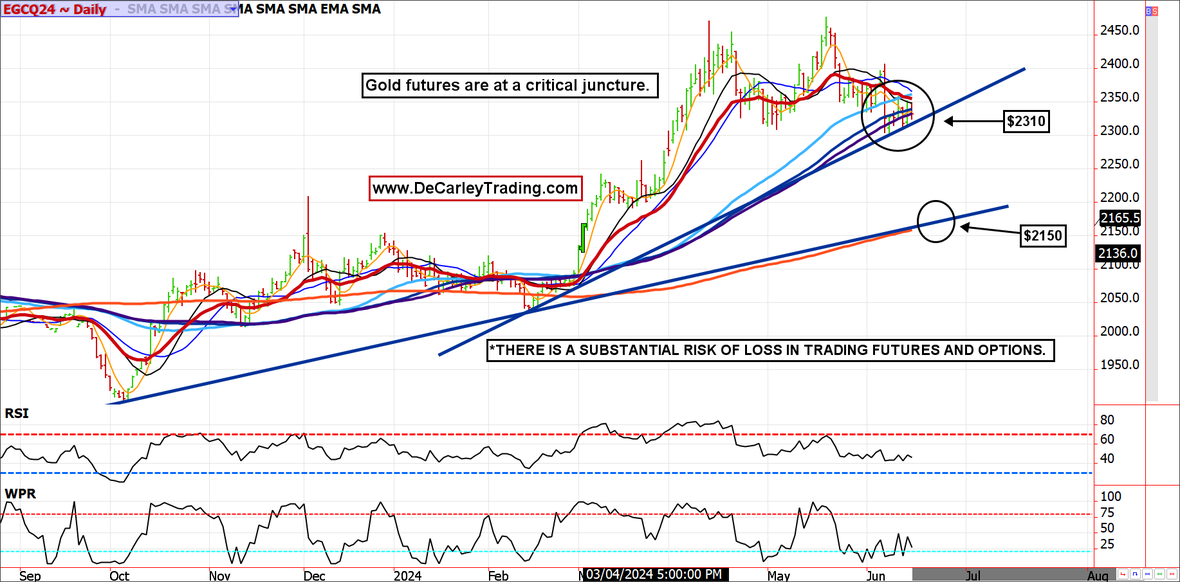
The daily chart offers a more optimistic view. If gold futures can hold trendline support near $2300, we would avoid a wave of liquidation into the mid-$2100s and, therefore, likely to continue the journey to just under $2600.
Conclusion
Despite significant setbacks, there is reason to be cautiously bullish on precious metals for now. That said, precious metals are the place for temporary portfolio diversification due to the lack of correlation with most assets and short-term speculation. On the contrary, long-term buy-and-hold strategies require intense patience and pain tolerance. As a reminder, those buying near the 2011 highs would have had to wait a decade of missing interest and dividends on that capital to get their money back. If you have allocated part of your portfolio to precious metals and gold prices, don’t be afraid to lock in gains along the way. You can do this efficiently by hedging in the futures/options markets or offsetting your metals holdings.
Author

Carley Garner
DeCarley Trading
Carley Garner is an experienced commodity broker with DeCarley Trading, a division of Zaner, in Las Vegas, Nevada. She is also the author of multiple books including, “Higher Probability Commodity Trading” and “A Trader's First Book on Commodities”.


