Healthy market pullback? The critical levels that will make or break [Video]
![Healthy market pullback? The critical levels that will make or break [Video]](https://editorial.fxstreet.com/images/Markets/Equities/SP500/wall_street_nyse4-637299025173341169_XtraLarge.jpg)
After the strong impulsive up swing, a pullback is anticipated as hinted by the rejection off the supply zone in S&P 500.
Watch the video below to find out the key levels to watch out for a healthy pullback in S&P 500 using the Wyckoff method and when you should raise a red flag as a early warning.
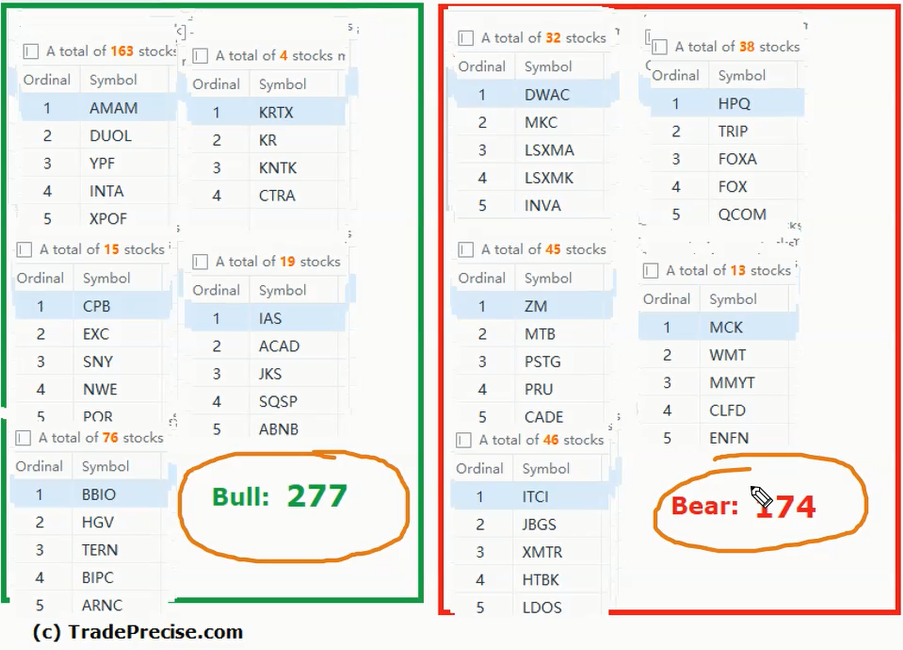
The bullish setup vs. the bearish setup is 277 to 174 from the screenshot of my stock screener below suggested still a positive market environment. However should the market experience a pullback, it is essential to pay attention to the failure of the entry setup.
Pay attention to the critical levels that S&P 500 needs to hold as discussed in the video above before raising the red flag as an early warning. The video above is part of the latest Weekly Live Group Coaching Session (1.5 hours) on 7 Mar 2023.
Author

Ming Jong Tey
Independent Analyst
Ming Jong Tey has been trading since 2008. He started his learning journey from technical analysis (indicators, Fibonacci, etc...) to value investing. Throughout his journey, he develops an interest in price action with chart pattern trading.


