Have we been in recession for years?
Have we already entered a recession? Worse, have we been in a recession for years now?
Recently I joined Jeff Tucker of the Brownstone Institute on an article about the Herculean task of trying to figure out what's actually happening in the economy.
Which is a challenge given every official economic number out there is broken.
I’ve covered some of these in recent videos, including failing to count homeless people as unemployed, calling welfare spending economic growth, and undercounting inflation — perhaps by a lot.
The thing is, if the official numbers are wrong, it could mean we're already in recession, masked by rising asset prices courtesy of the Fed.
Inflation: the key to recession
To give a flavor, the official inflation rate since COVID-19 has been around 21%. But fast food menu prices – a go-to indicator for Foreign exchange investors – are up between 35% and 50%. People posting grocery receipts online say it's actually more than 50%.
The problem is if inflation was actually, say, 35% it means GDP hasn't gone up at all since pre-Covid. It means it actually went down. Implying we've been in recession for nearly 5 years.
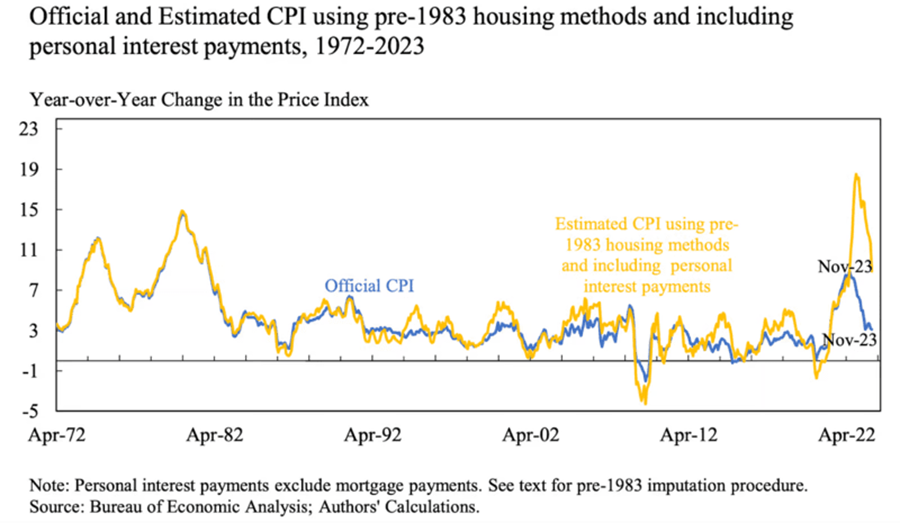
This is because official growth numbers are discounted by inflation. If growth was 3% but inflation was 2%, we grew. If inflation was actually 4%, we shrank.
That means that if inflation was actually worse than 35% — if, say, it was the 50% that grocery receipts say — that would put us near Depression levels with a 13% drop in real GDP since pre-Covid.
Are we in a hidden depression?
The idea seems absurd — it shocked me. But, historically, inflationary depressions are hard to see for the simple reason that asset prices pump before consumer prices do. The affluent keep spending since their stocks soared and their house prices soared – sound familiar?
In Germany's Weimar hyperinflation, for example, early on people weren't complaining about prices, they were popping champagne over how much money they were making on their stocks. The hunger came later.
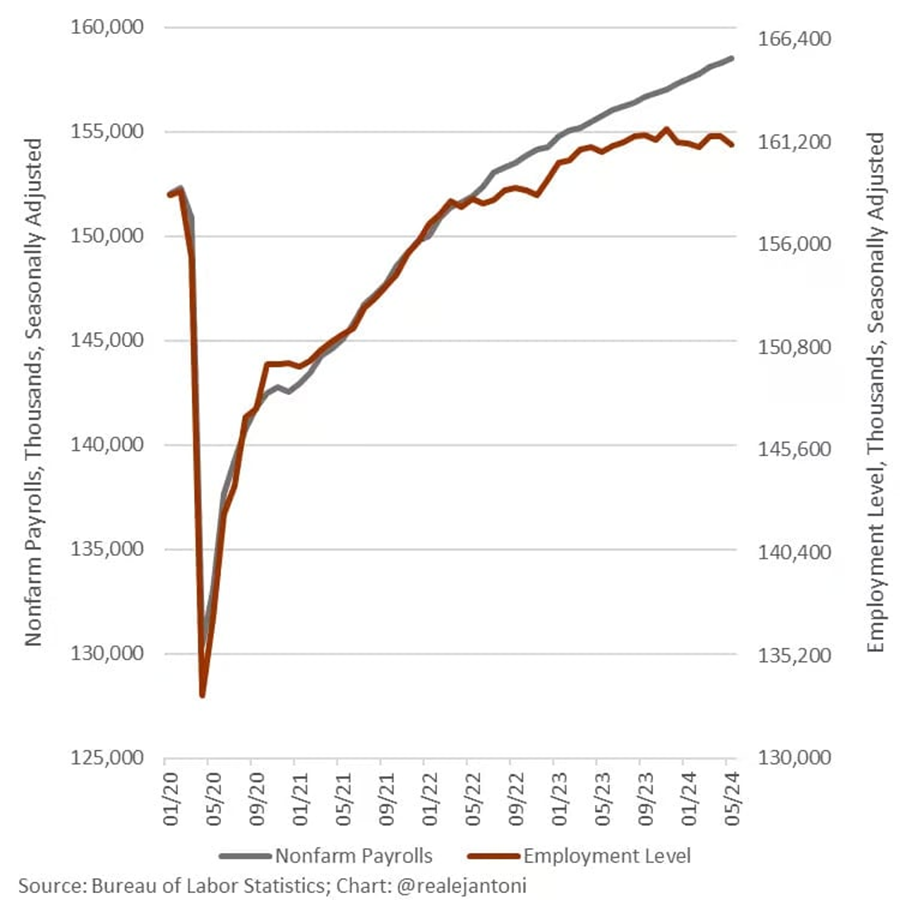
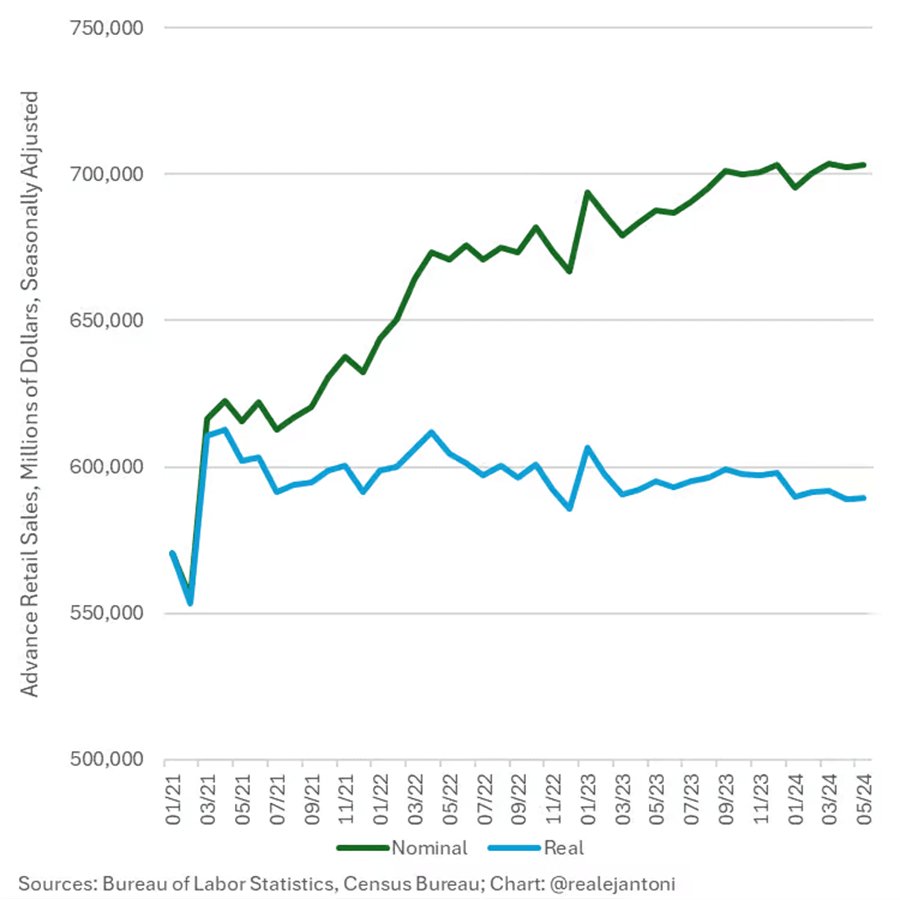
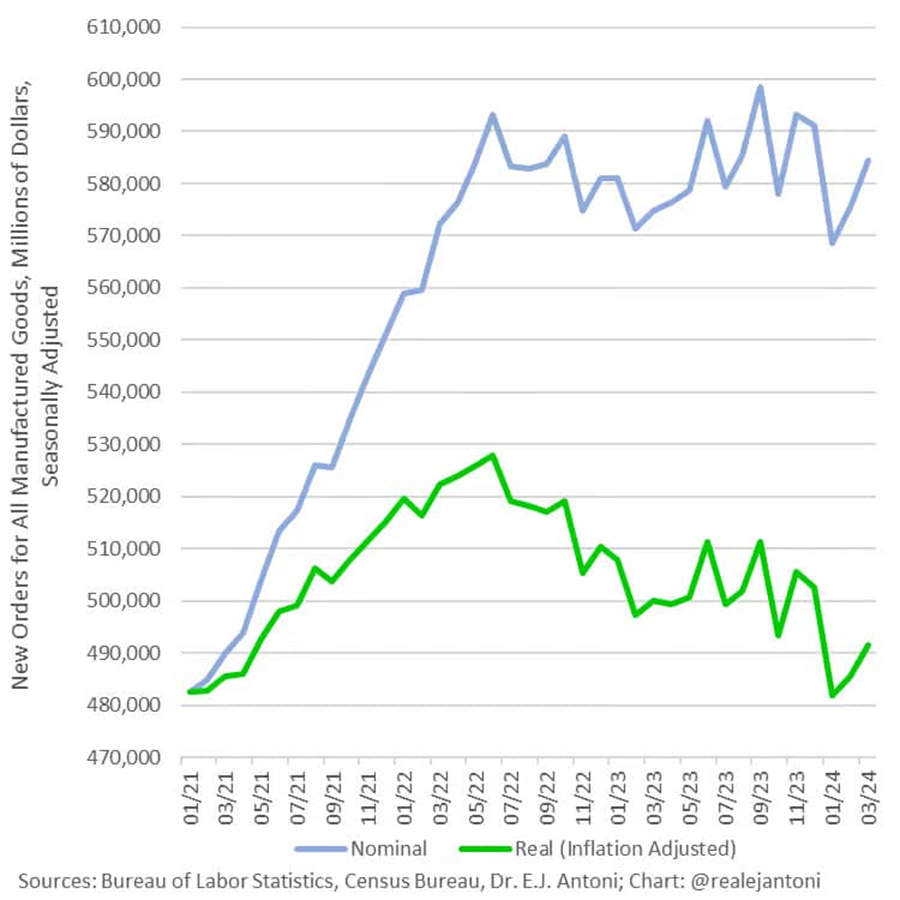
The 4-year depression theory explains a lot of otherwise mysterious data. My colleague EJ Antoni found that manufacturing orders have been flat for at least 3 years, while consumer spending has actually been negative for those 3 years. We get data points like Americans seeing McDonald's as a luxury item, buying groceries on credit cards, selling off second cars, and downsizing to smaller homes – all hallmarks of a recession.
Even that grandaddy of statistics, GDP, may be an illusion. Because GDP counts government spending as production.
Which, of course, it is not: it’s spending, not building. So our current $2 trillion deficit is, on paper, automagically boosting GDP by nearly 7%. But the spending isn't making us richer – it's making us poorer as physical resources get squandered.
It's the 1970s all over again, but worse
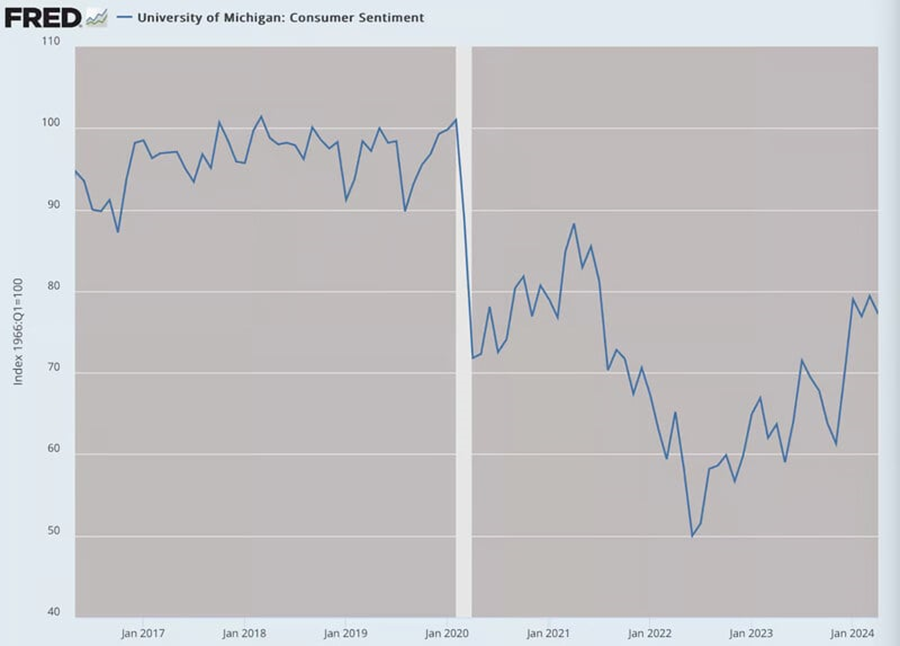
When the official numbers are lies, we’re left with data points and anecdotes like record credit card debt, financial distress among the middle class, and shrinking quality of life.
My base case has been that we're repeating the 1970s disaster driven by out-of-control government spending and out-of-control Fed money printing. The official numbers are matching that almost to a tee.
But if, in fact, the real numbers are much worse – perhaps even as bad as voters and consumer surveys report – then we could be headed towards a proper Depression.
To receive free commentary and analysis on the gold and silver markets, click here to be added to the Money Metals news service.
Author

Peter St. Onge, PhD
Money Metals Exchange
Peter St. Onge writes articles about Economics and Freedom. He's an economist at the Heritage Foundation, a Fellow at the Mises Institute, and a former professor at Taiwan’s Feng Chia University. His website is www.ProfStOnge.com.


