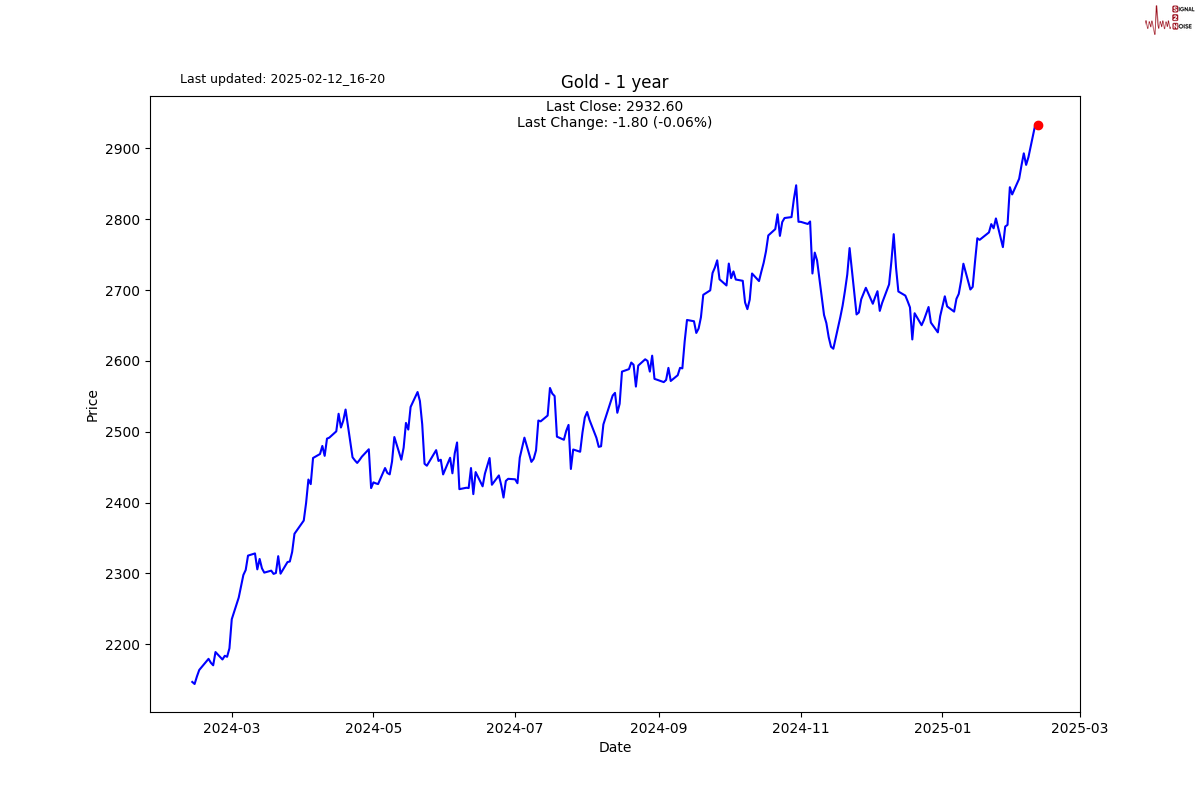
Has Gold gone too far?

S2N spotlight
Yesterday we shared some trend following strategy backtests and made a case for how strong gold has been, which you can review here. I forgot to add this chart yesterday; last year was a record number of all-time highs.
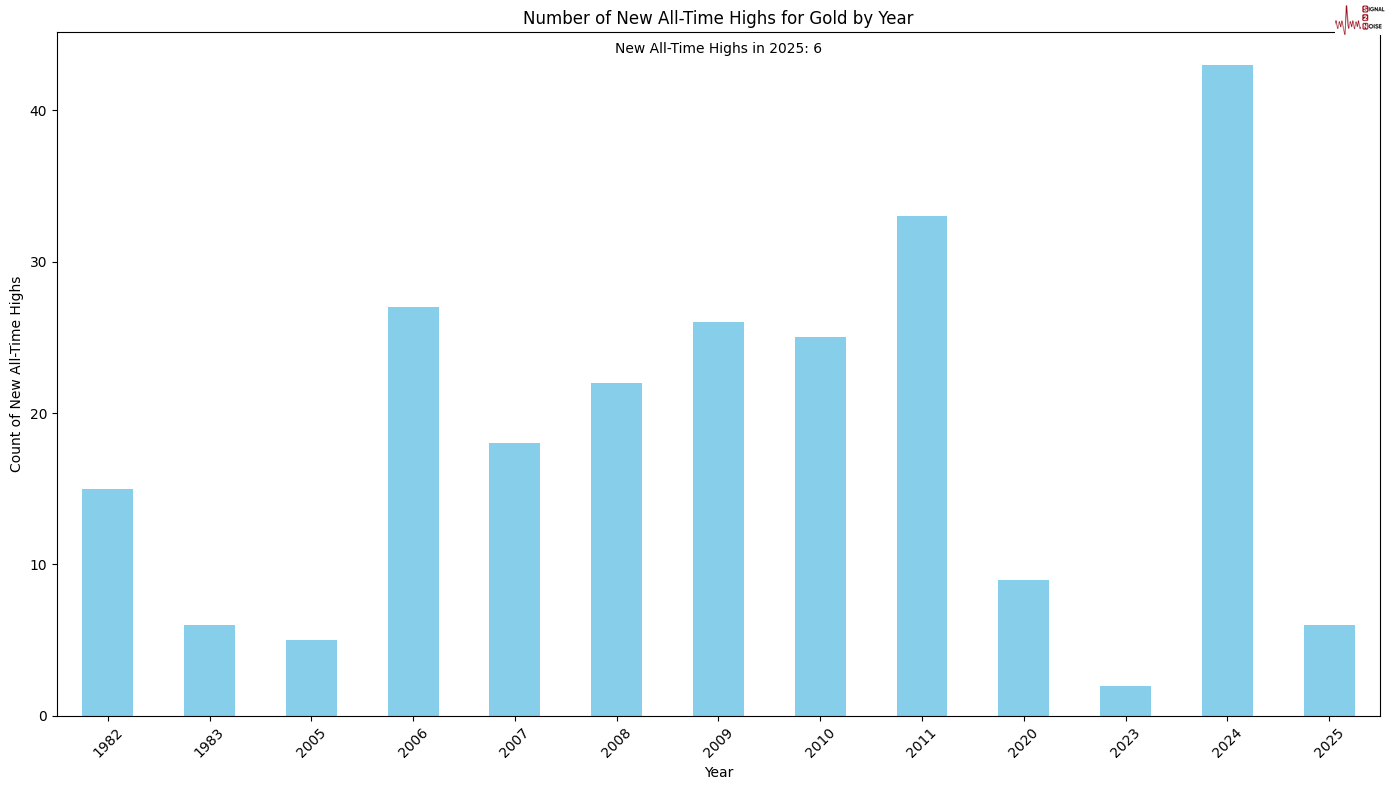
The question I want to ask today is: has gold gone too far?
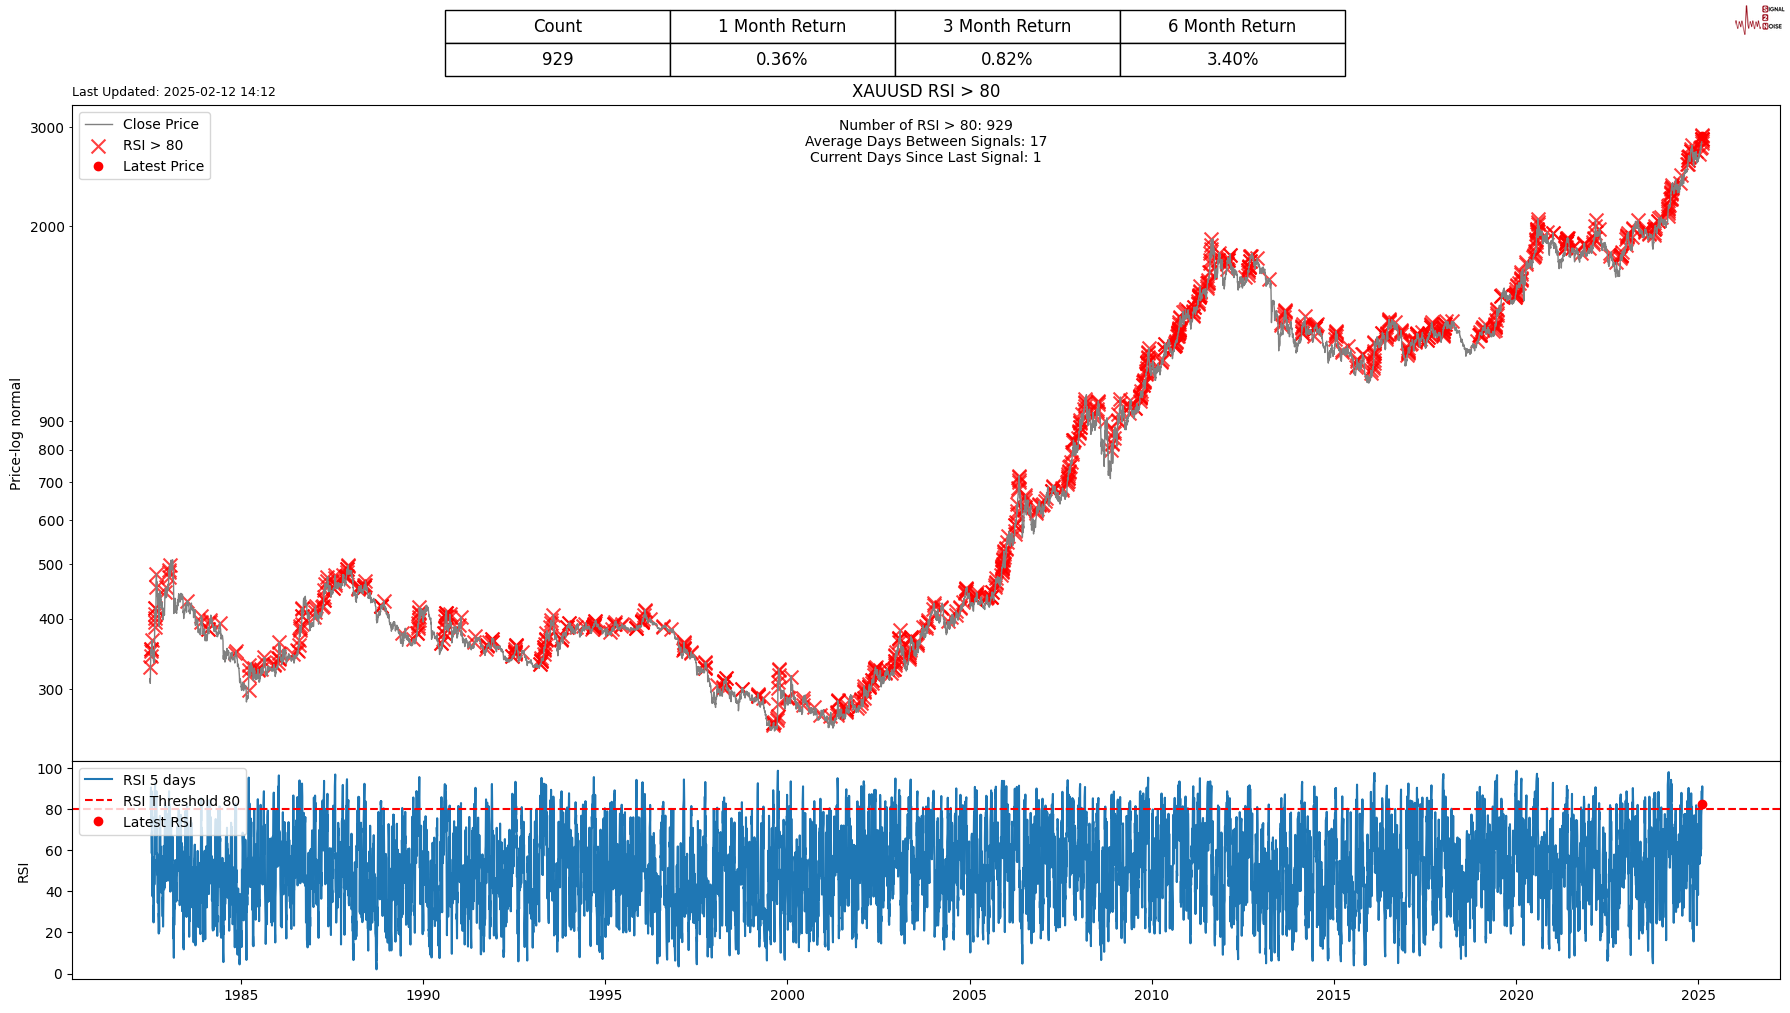
For simplicity sake, I am going to stick with daily data and see what happens when the short-term Relative Strength Index (RSI) is overbought. As you can see in the chart below, I am working with a 5-day RSI and sell my holdings when the RSI goes over 80 for an overbought signal. I mark it with a red cross on the chart; there are 929 red crosses, and then measure the performance of gold for 1 month, 3 months, and 6 months after each sell signal. Clearly, this is not a good signal, as all 3 time frames are positive. There are many ways to fine-tune this, like measuring the return 1 day after or 1 week. But we are not day traders so lets assume this is not the right sell signal.
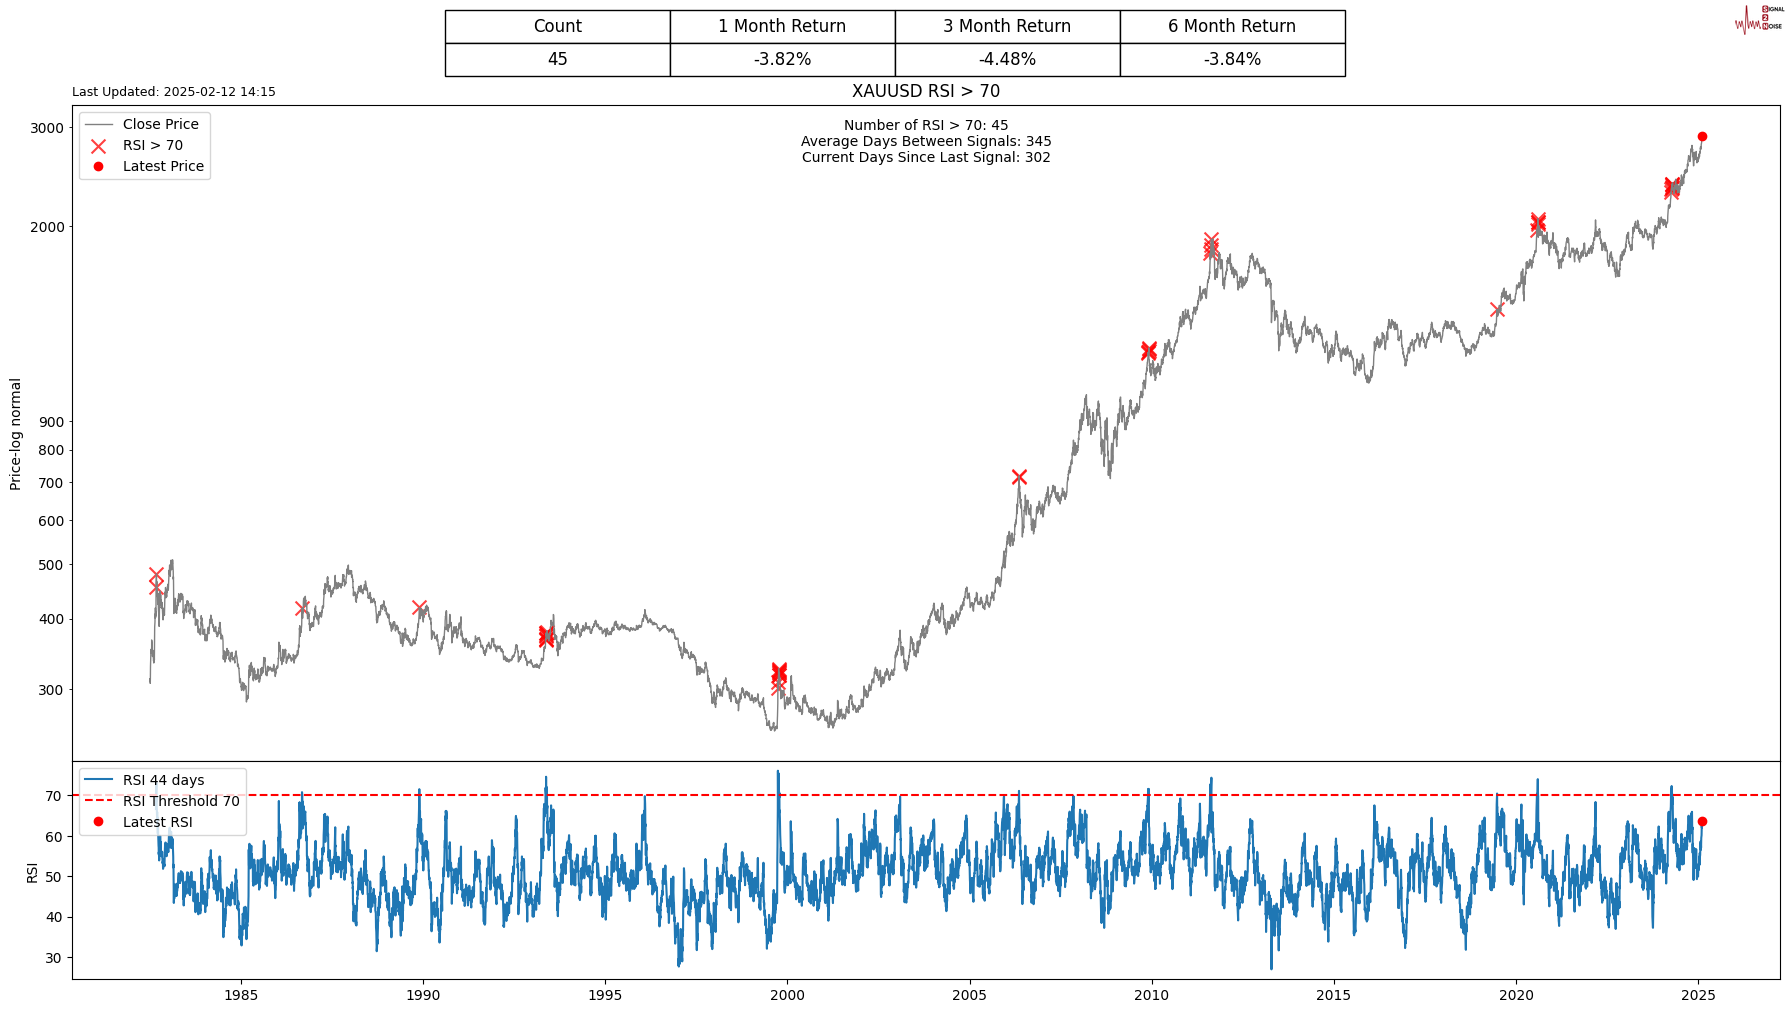
In this version, I have worked with a 44-day RSI (2 months (business days)) and a 70% threshold. As you can see, this is a much better signal generator; the only catch is that the current RSI reading is 60, so there is no sell signal.

S2N observations
I have one extra thing to add to the gold complex, and that is the gold/silver ratio. This chart shows that gold is more than 1.5 standard deviations from its long-term average with silver. The world is in a very precarious geopolitical situation at the moment, and the demand for safe havens is unlikely to abate any time soon. Silver could well play catch up and present a very good alternative in the precious metals space.
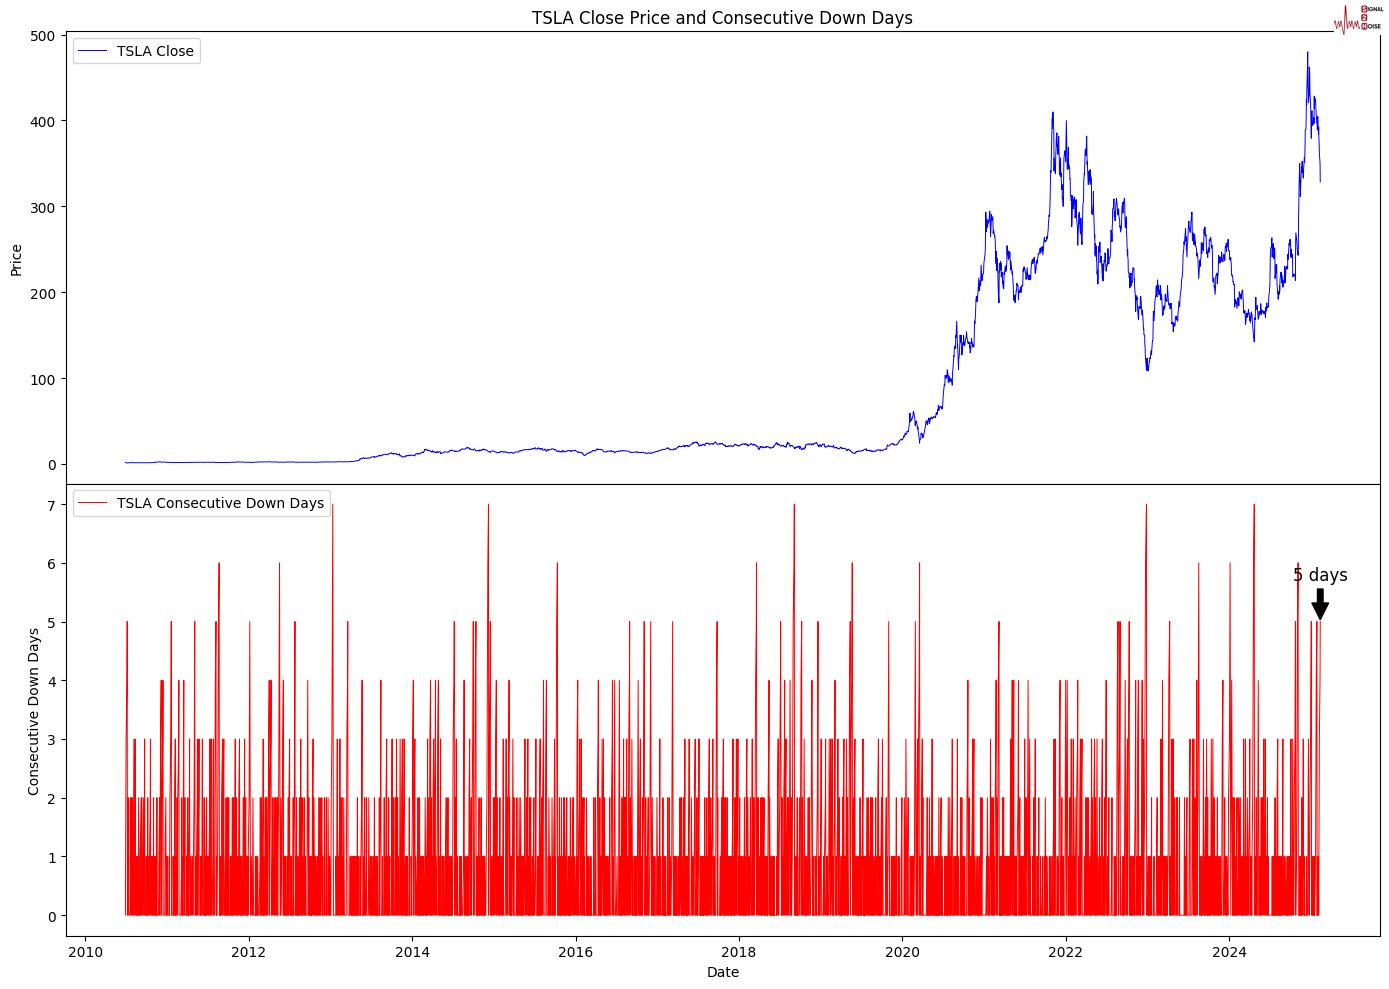
Tesla is under pressure with a 5-day down streak. This is not at record levels, but we are in a pretty rare space.
S2N screener alerts
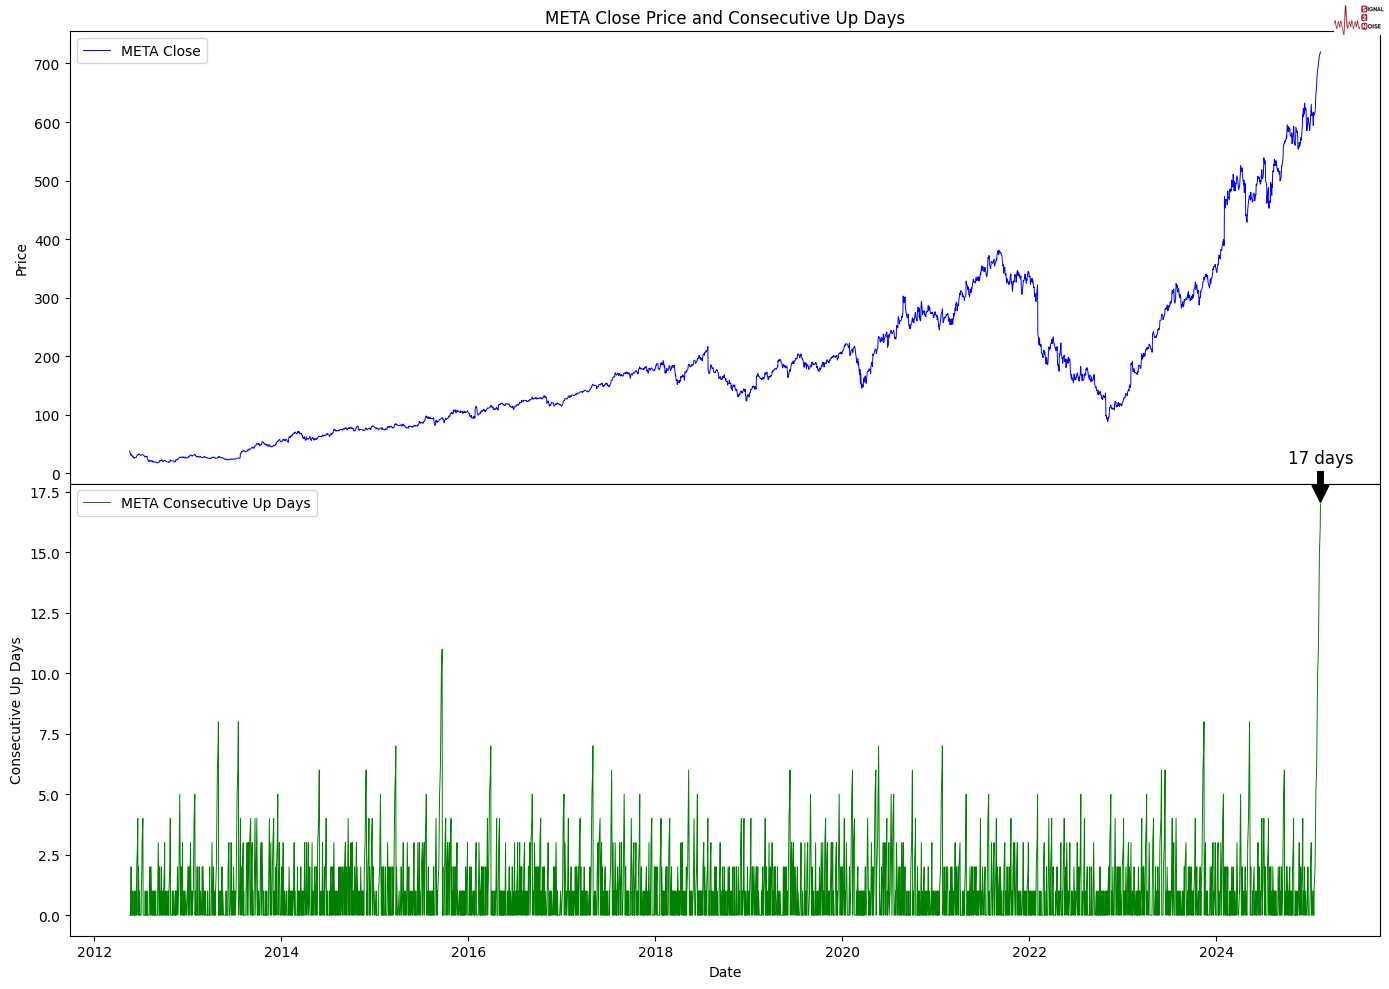
17 days and counting is how many days in a row META stock has been rising.
Performance review
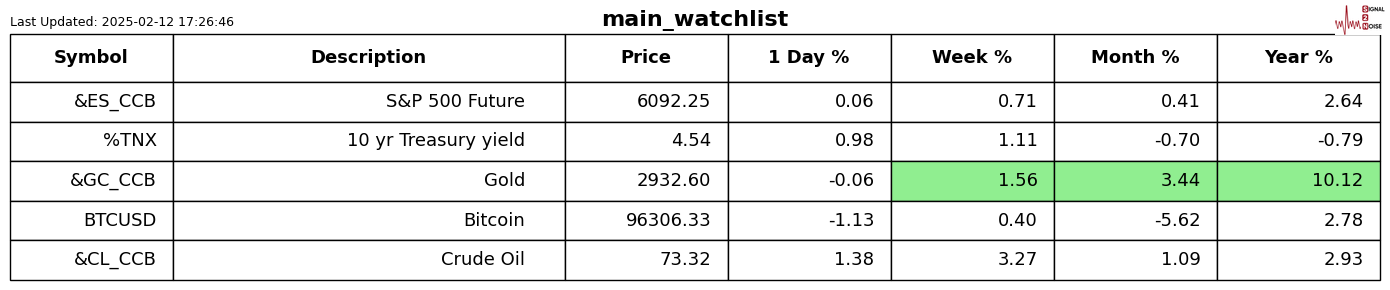
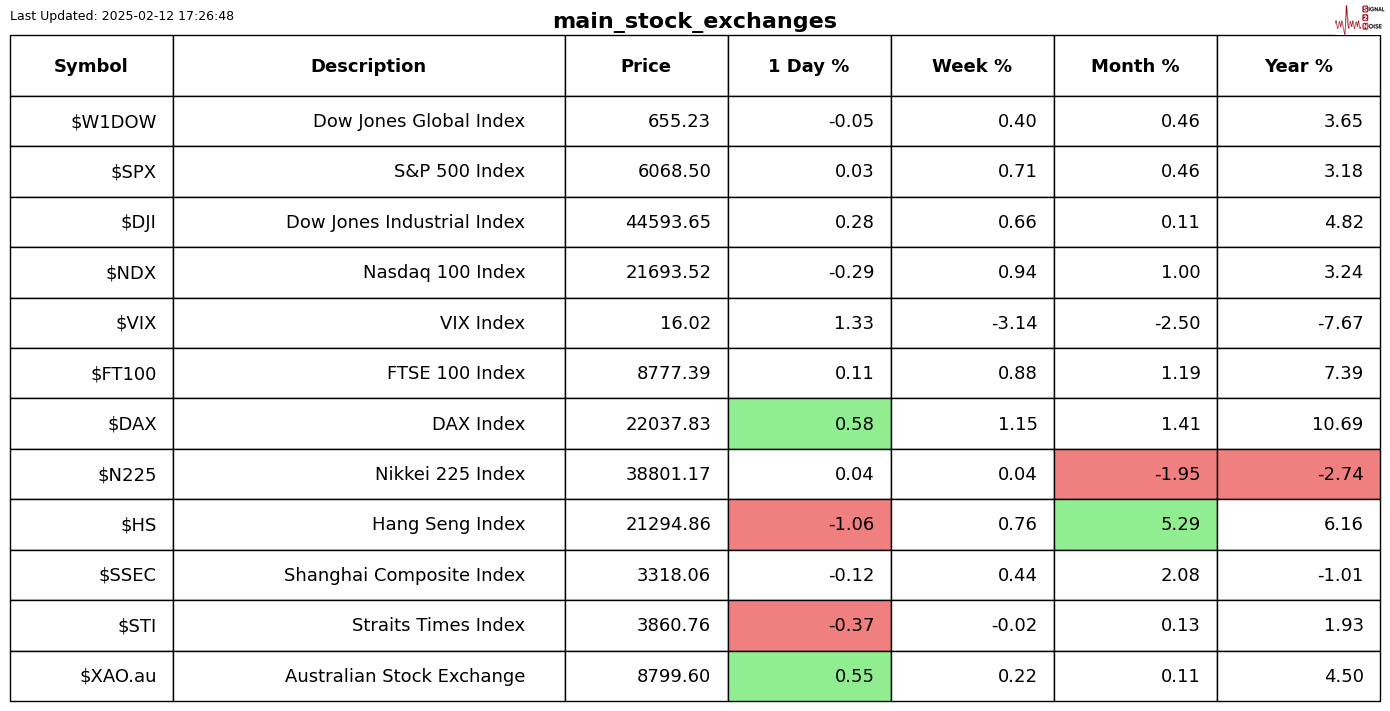
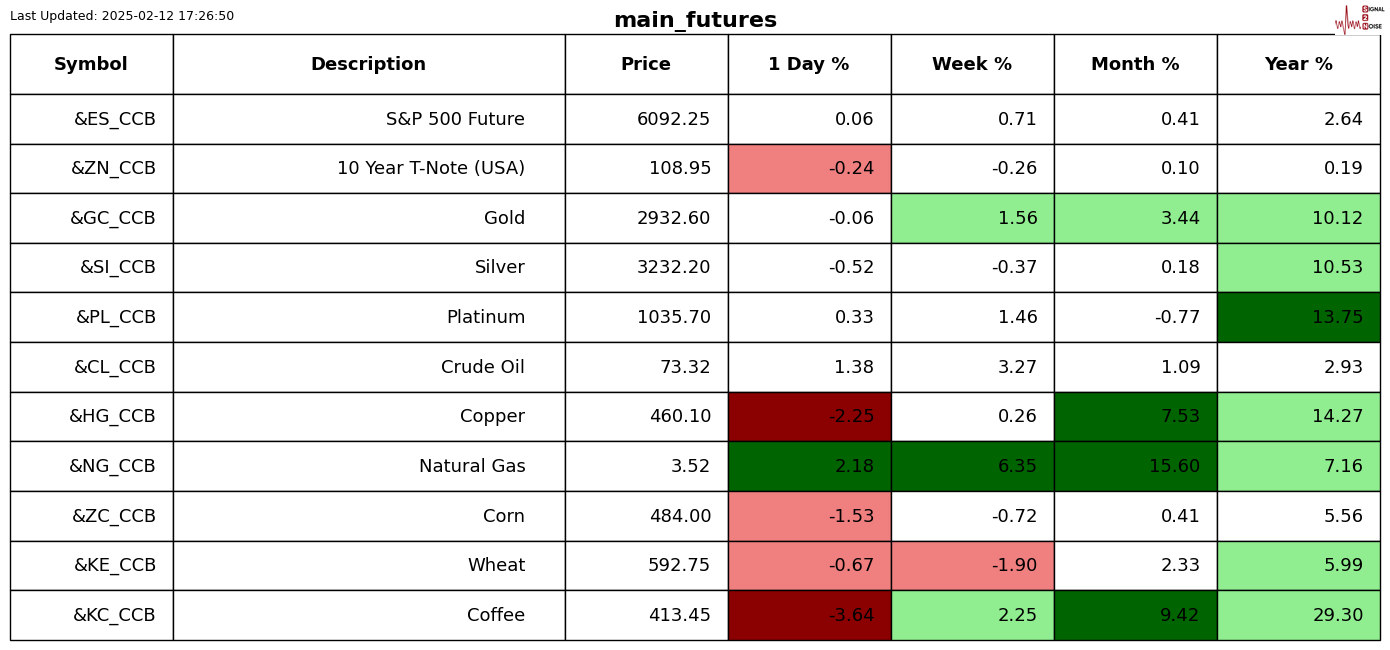
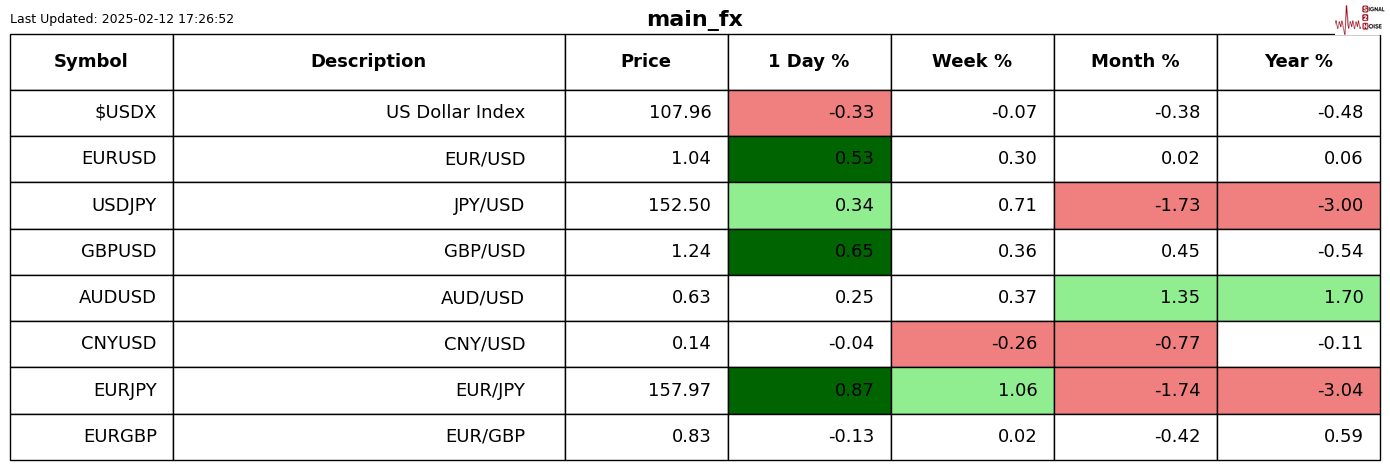
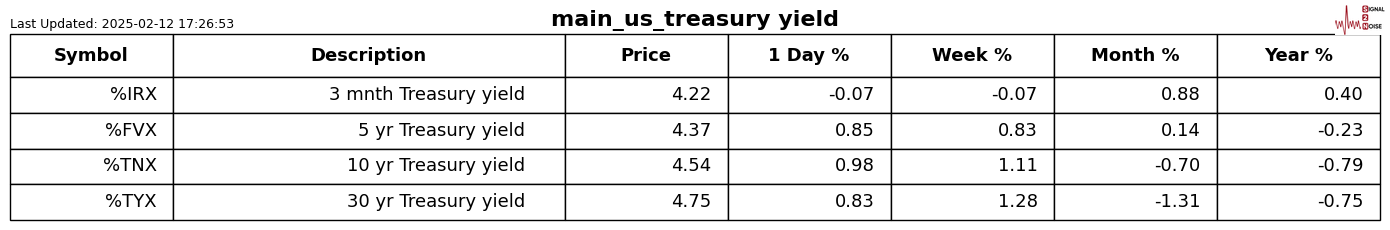
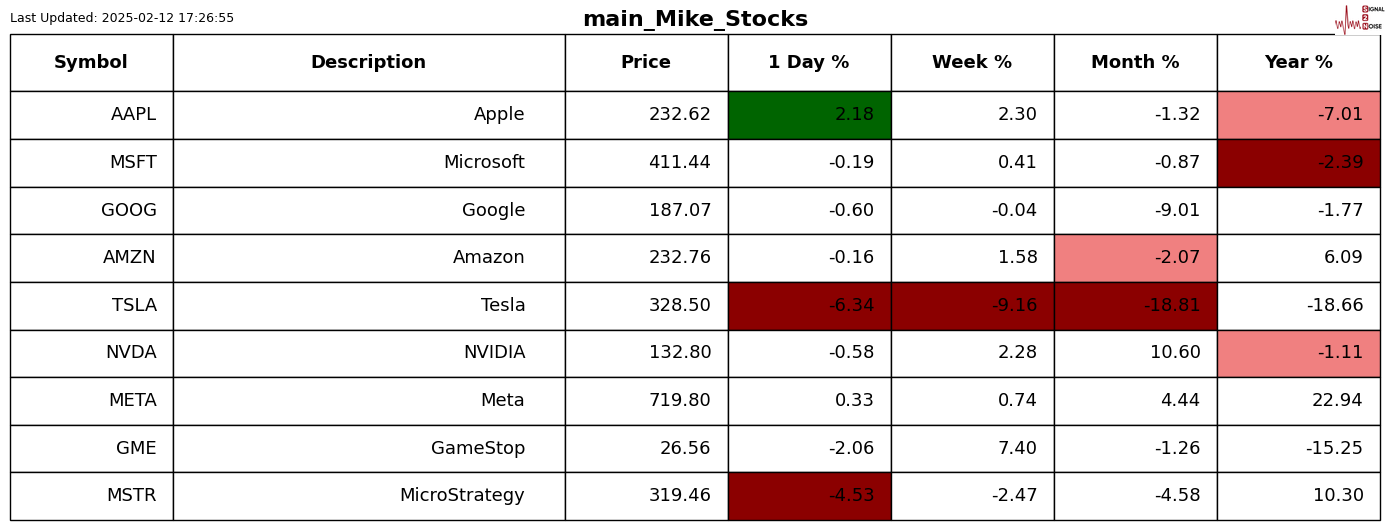
For those who are new to the letter, the shading is Z-Score adjusted so that only moves bigger than usual for the symbol are highlighted.
Chart gallery
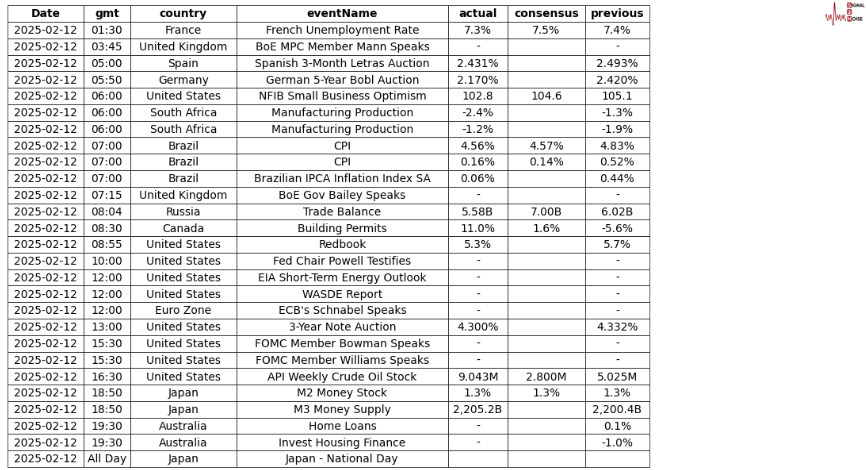
News today
Author

Michael Berman, PhD
Signal2Noise (S2N) News
Michael has decades of experience as a professional trader, hedge fund manager and incubator of emerging traders.


