USD: Dec '24 is Up at 105.365.

Energies: Dec '24 Crude is Down at 69.13.

Financials: The Dec '24 30 Year T-Bond is Down 11 ticks and trading at 117.16.

Indices: The Dec '24 S&P 500 emini ES contract is 70 ticks Higher and trading at 6043.00

Gold: The Dec'24 Gold contract is trading Down at 2671.00.

Initial conclusion

This is not a correlated market.  The USD is Up and Crude is Down which is normal, but the 30 Year T-Bond is trading Lower.  The Financials should always correlate with the US dollar such that if the dollar is Higher, then the bonds should follow and vice-versa. The S&P is Higher and Crude is trading Lower which is correlated. Gold is trading Lower which is correlated with the US dollar trading Up.  I tend to believe that Gold has an inverse relationship with the US Dollar as when the US Dollar is down, Gold tends to rise in value and vice-versa. Think of it as a seesaw, when one is up the other should be down. I point this out to you to make you aware that when we don't have a correlated market, it means something is wrong. As traders you need to be aware of this and proceed with your eyes wide open. Asia traded Mixed.  All of Europe is trading Higher. 

Possible challenges to traders

  • No Major Market news to speak of.

  • Lack of Major Market News.

Traders, please note that we've changed the Bond instrument from the 10 year (ZN) to the 2 year (ZT).  They work exactly the same.  

We've elected to switch gears a bit and show correlation between the 2-year Treasury notes (ZT) and the S&P futures contract.  The YM contract is the Dow Jones Industrial Average, and the purpose is to show reverse correlation between the two instruments.  Remember it's likened to a seesaw, when up goes up the other should go down and vice versa.

On Friday the ZT leapt Higher at around 7:30 AM EST with no economic news reported at that time.  The Dow dived Lower at the same time.  Look at the charts below and you'll see a pattern for both assets. The Dow moved Lower at 7:30 AM and the ZT moved Higher at around the same time.  These charts represent the newest version of Bar Charts, and I've changed the timeframe to a 15-minute chart to display better.  This represented a Long opportunity on the 2-year note, as a trader you could have netted about 20 plus ticks per contract on this trade.   Each tick is worth $7.625.  Please note: the front month for ZT is Dec and the Dow is now Dec '24.  I've changed the format to filled Candlesticks (not hollow) such that it may be more apparent and visible.

Charts courtesy of Barcharts

Chart

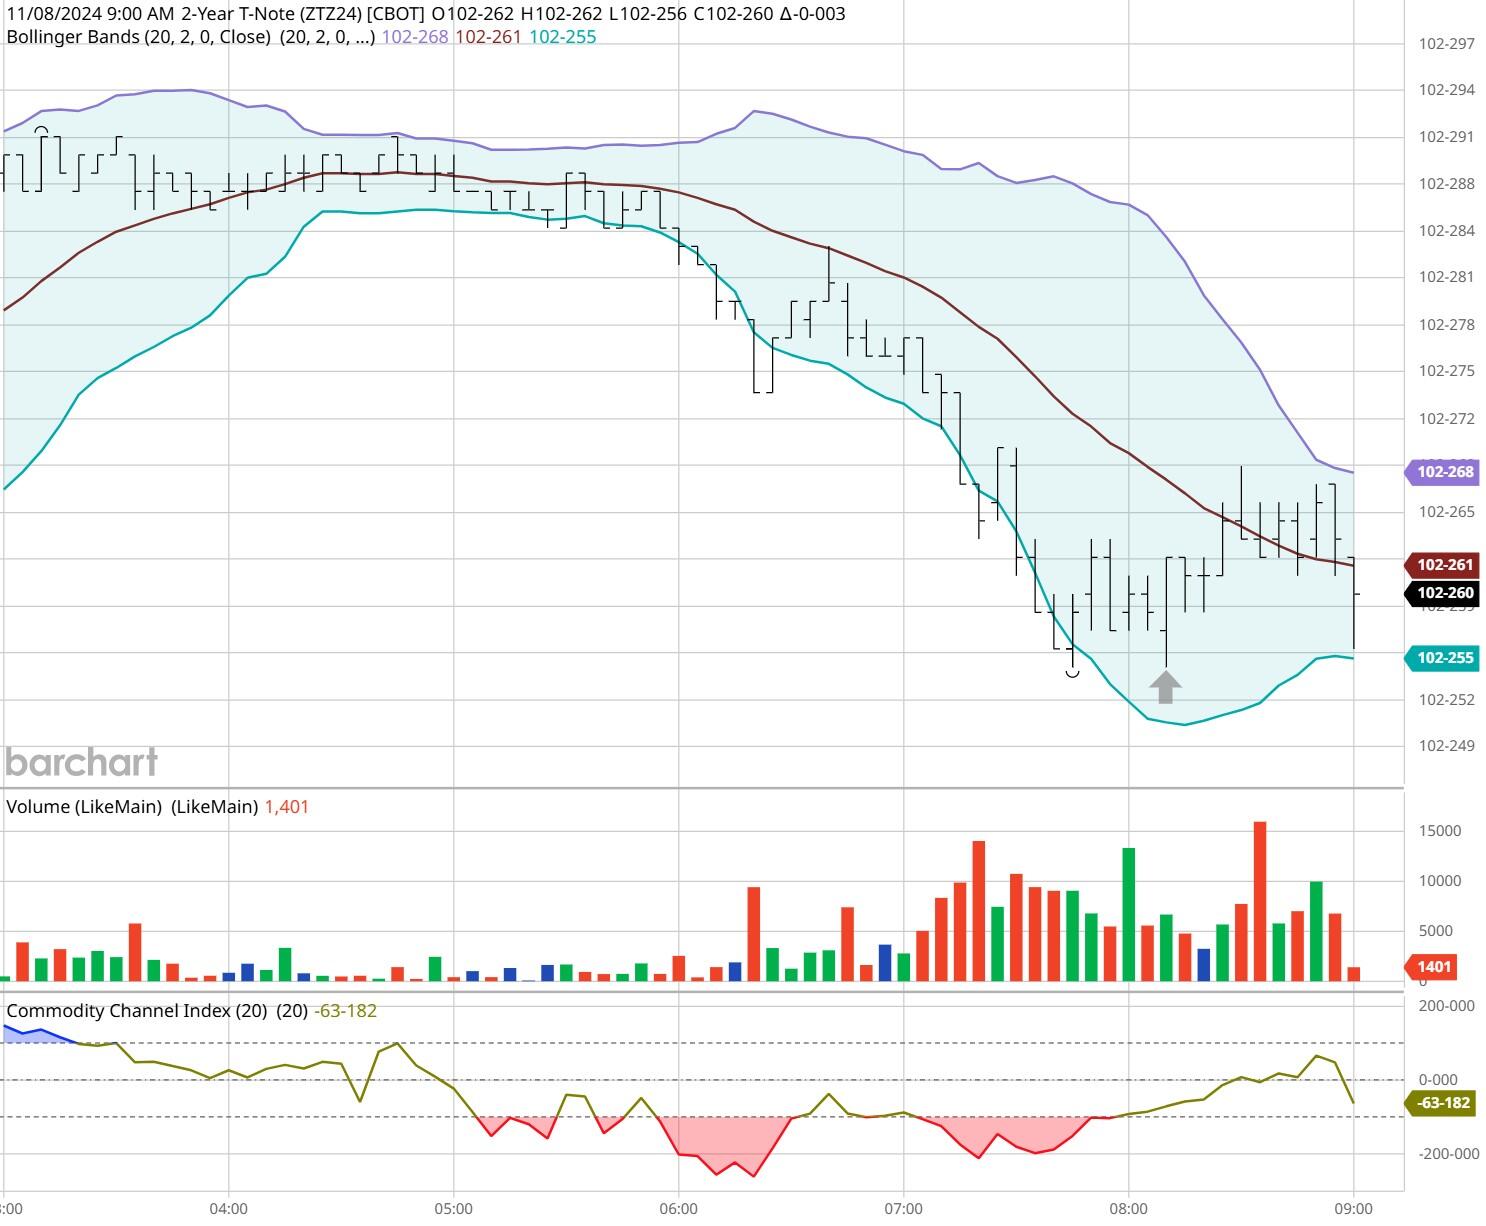
ZT -Dec 2024 - 11/08/24

Chart

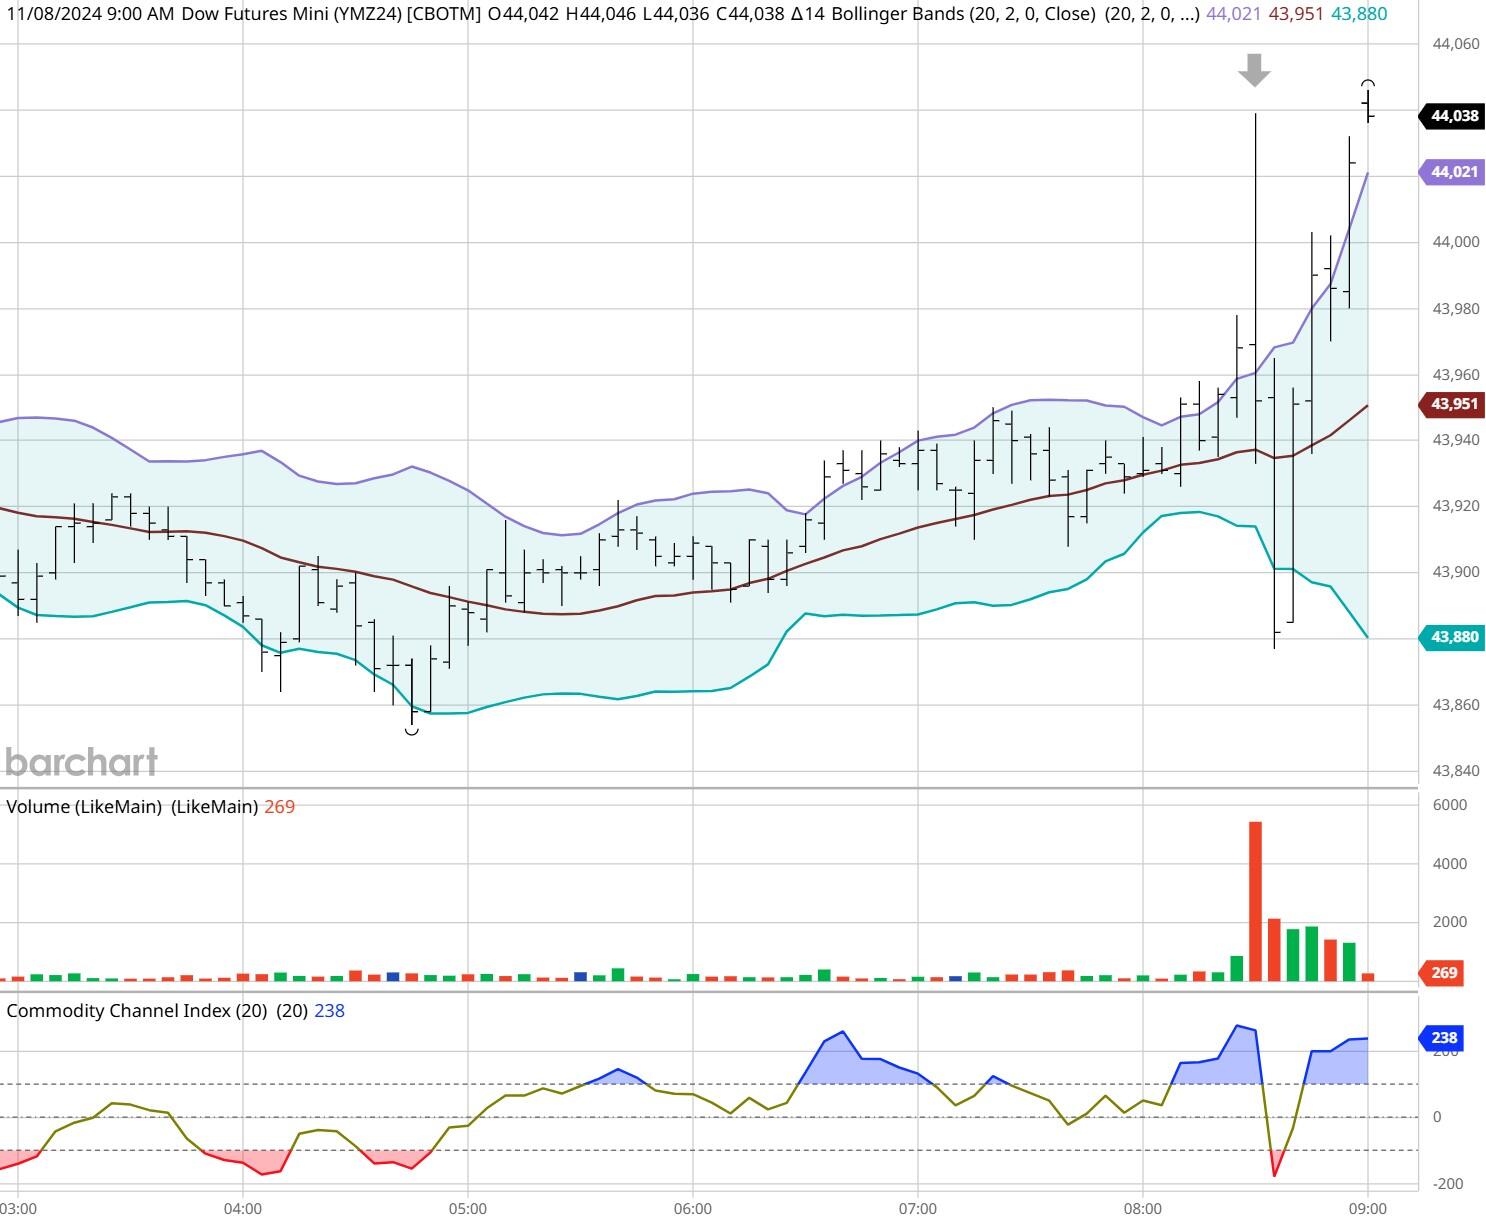
Dow - Dec 2024- 11/08/24

Bias

On Friday we gave the markets a Neutral or Mixed bias, but the markets traded to the Upside.  The Dow rose by 260 points and the other indices finished Higher as well.  Today we aren't dealing with a correlated market, and our bias is to the Upside.

Could this change? Of Course. Remember anything can happen in a volatile market.

Commentary

Today is Veterans Day in the United States and is a bank holiday here.  Banks are closed, the Post Office is closed and will not deliver mail today however the stock market is open but the bond market isn't.  What a week this has been.  We had a presidential election, an FOMC Meeting and now Veterans Day.  I swear it doesn't get more exciting and now the S&P cracked the 6,000 mark this past week.  I can only hope that this week will be calmer but as in all things, only time will tell. 

Trading performance displayed herein is hypothetical. The following Commodity Futures Trading Commission (CFTC) disclaimer should be noted.

Hypothetical performance results have many inherent limitations, some of which are described below. No representation is being made that any account will or is likely to achieve profits or losses similar to those shown.

In fact, there are frequently sharp differences between hypothetical performance results and the actual results subsequently achieved by any particular trading program. One of the limitations of hypothetical performance trading results is that they are generally prepared with the benefit of hindsight.

In addition, hypothetical trading does not involve financial risk, and no hypothetical trading record can completely account for the impact of financial risk in actual trading. For example, the ability to withstand losses or to adhere to a particular trading program in spite of trading losses are material points which can also adversely affect actual trading results.

There are numerous other factors related to the markets in general or to the implementation of any specific trading program which cannot be fully accounted for in the preparation of hypothetical performance results and all of which can adversely affect actual trading results.

Trading in the commodities markets involves substantial risk and YOU CAN LOSE A LOT OF MONEY, and thus is not appropriate for everyone. You should carefully consider your financial condition before trading in these markets, and only risk capital should be used.

In addition, these markets are often liquid, making it difficult to execute orders at desired prices. Also, during periods of extreme volatility, trading in these markets may be halted due to so-called “circuit breakers” put in place by the CME to alleviate such volatility. In the event of a trading halt, it may be difficult or impossible to exit a losing position.

Recommended Content


Recommended Content

Editors’ Picks

EUR/USD remains offered and below 1.1300

EUR/USD remains offered and below 1.1300

EUR/USD is feeling the squeeze, revisiting the area around 1.1280 as the US Dollar gains extra momentum on Tuesday. Mixed domestic data from Industrial Production and Economic Sentiment haven't done the Euro any favours either.

EUR/USD News
GBP/USD keeps the bullish stance in the low-1.3200s

GBP/USD keeps the bullish stance in the low-1.3200s

After hitting fresh six-month peaks near 1.3250, GBP/USD is now under a tepid selling pressure due to a strong comeback in the Greenback, causing it to retreat toward the 1.3200 support area. Next on the UK docket are inflation figures, expected to be released on Wednesday.

GBP/USD News
Gold embarks on a consolidative move around $3,200

Gold embarks on a consolidative move around $3,200

Gold is holding its own on Tuesday, trading just above $3,200 per troy ounce as it bounces back from earlier losses. While a more upbeat risk sentiment is bolstering the rebound, lingering concerns over a deepening global trade rift have prevented XAU/USD from rallying too aggressively.

Gold News
XRP, Dogecoin and Mantra traders punished for bullish bets, will altcoins recover? 

XRP, Dogecoin and Mantra traders punished for bullish bets, will altcoins recover? 

Altcoins are recovering on Tuesday as the dust settles on US President Donald Trump’s tariff announcements last week. The President has repeatedly changed his mind on several tariff-related concerns, ushering volatility in Bitcoin and altcoin prices. 

Read more
Is a recession looming?

Is a recession looming?

Wall Street skyrockets after Trump announces tariff delay. But gains remain limited as Trade War with China continues. Recession odds have eased, but investors remain fearful. The worst may not be over, deeper market wounds still possible.

Read more
The Best brokers to trade EUR/USD

The Best brokers to trade EUR/USD

SPONSORED Discover the top brokers for trading EUR/USD in 2025. Our list features brokers with competitive spreads, fast execution, and powerful platforms. Whether you're a beginner or an expert, find the right partner to navigate the dynamic Forex market.

Read More

Majors

Cryptocurrencies

Signatures

Best Brokers of 2025