GX Uranium ETF Elliott Wave analysis
Shortly after breaking the May 2024 high in October of the same year, GX URA ETF started correcting the bullish impulse from August 2024 that led to this break. Meanwhile, the pullback has reached a key Fibonacci zone and could make a significant bounce which should propel the long-term impulse sequence higher.
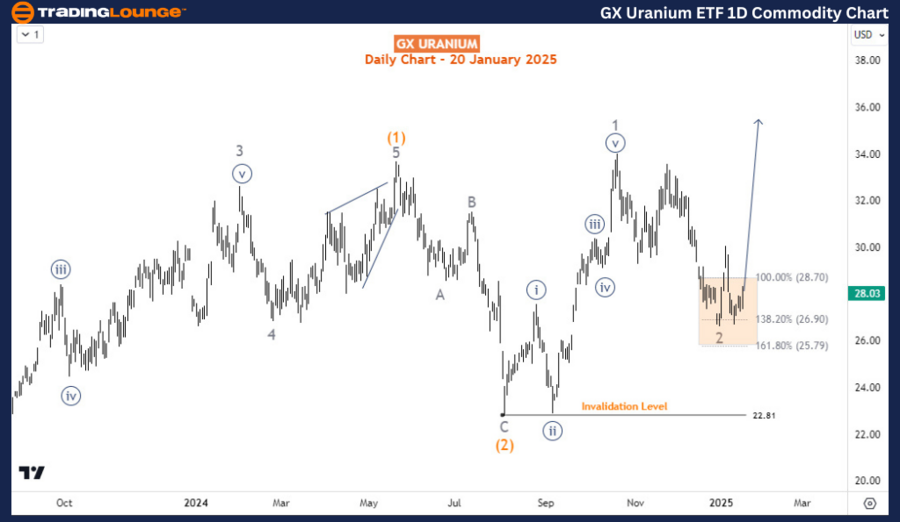
GX URA ETF daily chart analysis
In the long term, GX URA ETF is correcting the long-term bearish impulse structure that emerged between February 2011 and March 2020. This bullish correction finished the first leg, wave ((A)), in November 2021 and then wave ((B)) in July 2022. from July 2022, wave ((C)) emerged.
The daily chart showed the price completed waves (1) and (2) of ((C)) in May 2024 and August 2024 respectively. The impulse rally rally from August 2024 that breached the May 2024 high is identified as wave 1 of (3). The pullback from October 2024 is identified as wave 2 of (3). Thus, while 22.81 continues to hold, traders can expect support for this commodity leading to higher prices in the coming weeks.
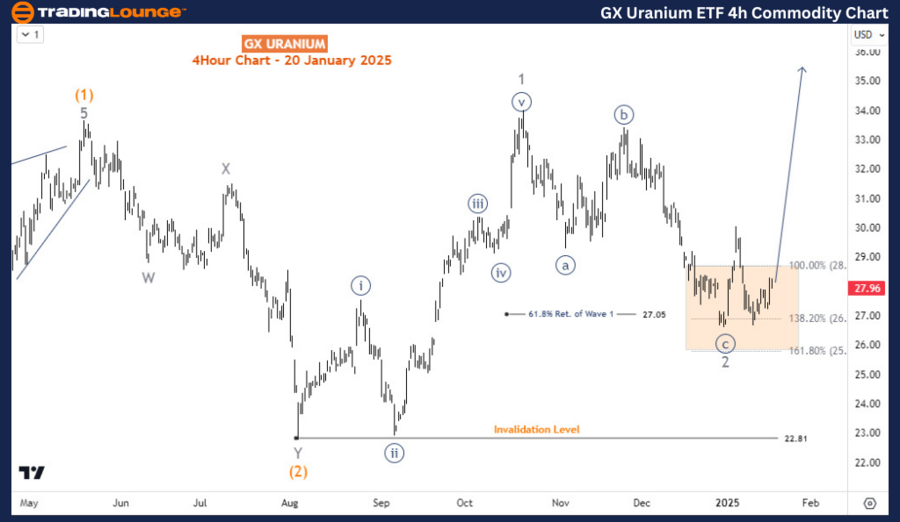
GX URA ETF four-hour chart analysis
The H4 chart shows the sub-waves of waves 1 and 2 and how the latter is currently being rejected at the Fibonacci support zone of 28.7-25.79. If this zone is not breached, buyers should have the confidence to push higher in wave 3 of (3) toward $42 in the coming weeks. Thus, the upside is favored to continue in both the short and medium-terms.
GX Uranium ETF Elliott Wave technical analysis [Video]
As with any investment opportunity there is a risk of making losses on investments that Trading Lounge expresses opinions on.
Historical results are no guarantee of future returns. Some investments are inherently riskier than others. At worst, you could lose your entire investment. TradingLounge™ uses a range of technical analysis tools, software and basic fundamental analysis as well as economic forecasts aimed at minimizing the potential for loss.
The advice we provide through our TradingLounge™ websites and our TradingLounge™ Membership has been prepared without considering your objectives, financial situation or needs. Reliance on such advice, information or data is at your own risk. The decision to trade and the method of trading is for you alone to decide. This information is of a general nature only, so you should, before acting upon any of the information or advice provided by us, consider the appropriateness of the advice considering your own objectives, financial situation or needs. Therefore, you should consult your financial advisor or accountant to determine whether trading in securities and derivatives products is appropriate for you considering your financial circumstances.
Recommended Content
Editors’ Picks
AUD/USD recovers above 0.6200 on upbeat Chinese PMI data
The AUD/USD pair recovers some lost ground to near 0.6215, snapping the six-day losing streak during the early Asian session on Monday. The upbeat Chinese economic data provides some support to the pair.
EUR/USD: More Trump trade war and the ECB in the docket
After trading choppily for most of the week, the EUR/USD pair plummeted on Thursday, bottoming early Friday at 1.0379, its lowest in over two weeks. It got to bounce modestly from the level ahead of the close, settling at around 1.0400.
Gold: Bulls finally let go as key support fails
Gold turned south after setting a new all-time high to begin the week. Investors will remain focused on Trump tariff talks ahead of February US employment data. The technical outlook points to a bearish reversal in the near term.
Week ahead: NFP and ECB to steal the show
NFP take center stage amid DOGE layoffs. ECB decides monetary policy after CPI data. Canada jobs report and RBA minutes also on tap.
Weekly focus – Tariff fears are back on the agenda
While the timing of the EU measures remains still uncertain, Trump surprised markets on Thursday by signalling that the 25% tariffs on Canada and Mexico will be enacted when the one-month delay runs out next Tuesday.
The Best brokers to trade EUR/USD
SPONSORED Discover the top brokers for trading EUR/USD in 2025. Our list features brokers with competitive spreads, fast execution, and powerful platforms. Whether you're a beginner or an expert, find the right partner to navigate the dynamic Forex market.