GX Uranium ETF Elliott Wave technical analysis [Video]
![GX Uranium ETF Elliott Wave technical analysis [Video]](https://editorial.fxstreet.com/images/Markets/Commodities/Metals/metal-shavings-gm133537548-17887573_XtraLarge.jpg)
GX URA Elliott Wave analysis
The Global X Uranium ETF (GX URA) provides investors exposure to the uranium sector, tracking companies engaged in uranium mining, exploration, and production globally. As nuclear energy gains traction as a cleaner power source, uranium demand could rise, positioning the GX URA ETF as an appealing opportunity for investors interested in the sector's potential growth.
The GX URA ETF remains bullish from March 2020 making higher highs and higher lows. The previous was formed in May 2024 and the price already breached in October after a 10-week pullback from May 2024.
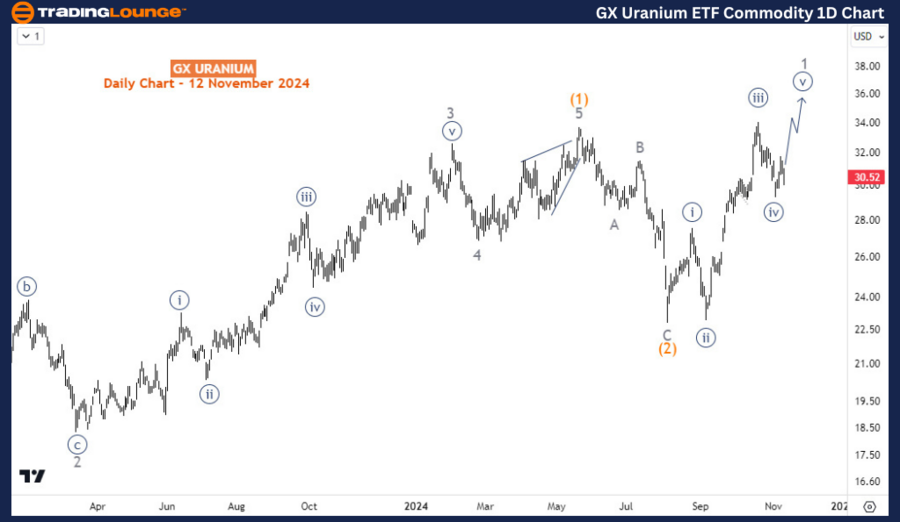
Daily chart analysis
Following this low, the ETF completed an impulsive wave A (circled) of the primary degree by November 2021, marking the first phase of a larger corrective structure. A corrective pullback was then developed for wave B (circled) and ended in July 2022. From there, an impulsive wave structure took shape for wave (1) of C (circled), culminating in May 2024. A pullback followed, forming wave (2) as shown on the daily chart. Currently, the rally that began on August 5, 2024, is likely the start of wave 1 of (3), signaling the next phase of the bullish recovery. With wave 1 still developing, significant upside potential remains as the correction unfolds.
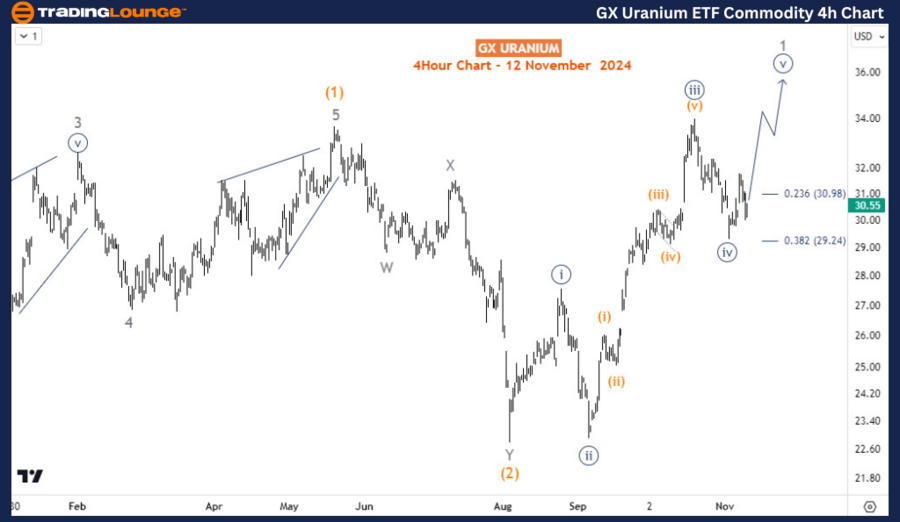
Four-hour chart analysis
H4 chart analysis shows wave 1 of (3) is still developing. Currently, the price has completed wave ((iv)) of 1 and still favors further rallies in wave ((v)) of 1 toward $35 before a larger pullback in wave 2.
GX Uranium ETF Elliott Wave technical analysis [Video]
Author

Peter Mathers
TradingLounge
Peter Mathers started actively trading in 1982. He began his career at Hoei and Shoin, a Japanese futures trading company.


