|

Growth and Collapse in CME

Chaos Clinic for 5/29/2020
 

CME chart

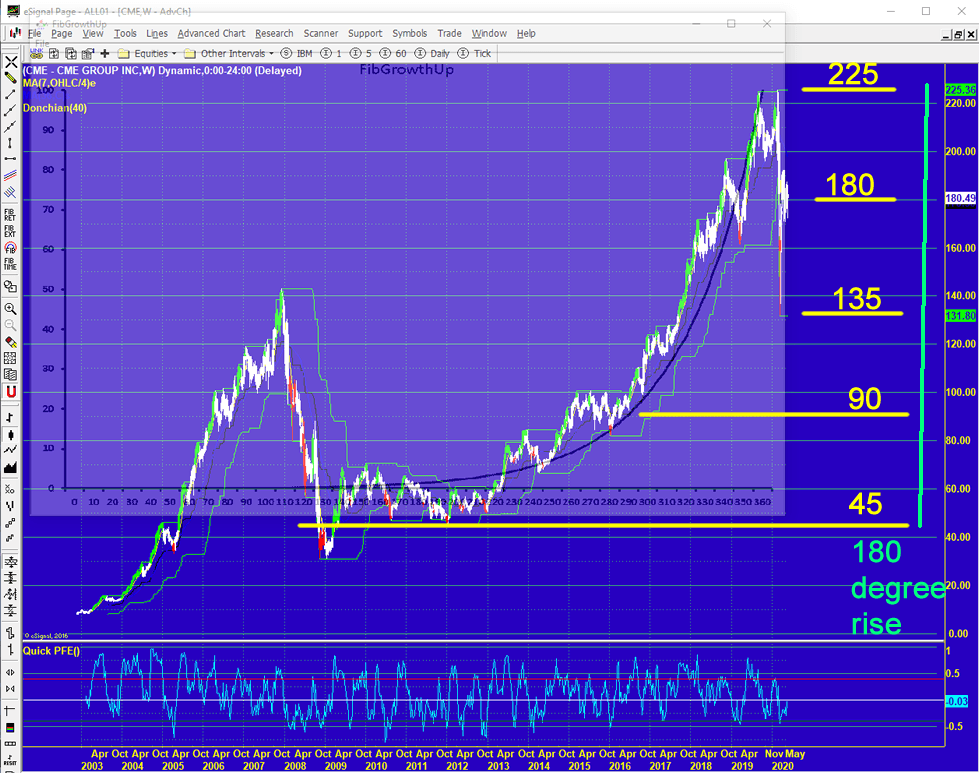
This chart shows the CME stock, essentially the CME derivatives exchange,over the past 18 years.

Overlaid on the chart is a mathematical power curve I discovered in my research into how markets work. It is based on the square root of a Fibonacci series. It also has a 360 degree cycle scale,which helps determine natural cycles behind the growth. Markets are moved by energy, and energy adds together based on mathematics.

This curve is essentially flat until the 180 degree point, then if rises faster, and faster, and faster. Then it collapses. My best estimate of the cycle involved in this example is about 18 years, close to the cycle of the Moon's node.

Another principle of energy addition is that energy adds harmonically, in circles of 360 degrees. This is clear in CME, where the rally moved up 180 degrees, from 45 to 225 degrees.

The harmonics are also apparent post peak. The first down move was 90 degrees, from 225 to 135. The bounce since then was 45 degrees to 180.

Longer term, these power curves often have a matching declining curve, of about the same duration as the half cycle up in what is a "time domain resonance." That suggests the down move could take about 9.3 years.

Author

Dr. Al Larson, PhD

Dr. Al Larson, PhD

MoneyTide.com

Dr. Al Larson holds a Ph.D. in Electrical and Computer Engineering from the University of Wisconsin. He is a 1964 Distinguished Graduate of the U. S. Air Force Academy.

More from Dr. Al Larson, PhD
Share:

Markets move fast. We move first.

Orange Juice Newsletter brings you expert driven insights - not headlines. Every day on your inbox.

By subscribing you agree to our Terms and conditions.

Editor's Picks

EUR/USD struggles for direction amid USD gains

EUR/USD is trimming part of its earlier gains, coming under some mild downside pressure near 1.1730 as the US Dollar edges higher. Markets are still digesting the Fed’s latest rate decision, while also looking ahead to more commentary from Fed officials in the sessions ahead.

GBP/USD drops to daily lows near 1.3360

Disappointing UK data weighed on the Sterling towards the end of the week, triggering a pullback in GBP/USD to fresh daily lows near 1.3360. Looking ahead, the next key event across the Channel is the BoE meeting on December 18.

Gold losses momentum, challenges $4,300

Gold now gives away some gains and disputes the key $4,300 zone per troy ounce following earlier multi-week highs. The move is being driven by expectations that the Fed will deliver further rate cuts next year, with the yellow metal climbing despite a firmer Greenback and rising US Treasury yields across the board.

Litecoin Price Forecast: LTC struggles to extend gains, bullish bets at risk

Litecoin (LTC) price steadies above $80 at press time on Friday, following a reversal from the $87 resistance level on Wednesday. Derivatives data suggests a bullish positional buildup while the LTC futures Open Interest declines, flashing a long squeeze risk.

Big week ends with big doubts

The S&P 500 continued to push higher yesterday as the US 2-year yield wavered around the 3.50% mark following a Federal Reserve (Fed) rate cut earlier this week that was ultimately perceived as not that hawkish after all. The cut is especially boosting the non-tech pockets of the market.

Aave Price Forecast: AAVE primed for breakout as bullish signals strengthen

Aave (AAVE) price is trading above $204 at the time of writing on Friday and approaching the upper boundary of its descending parallel channel; a breakout from this structure would favor the bulls.