Goodbye, Gold price rally – Here’s what’s next

Gold price is finally declining – that’s the biggest overnight slide in many days – times are changing – or are they?
Let’s start with a quote from the analysis that I sent over the weekend:
-
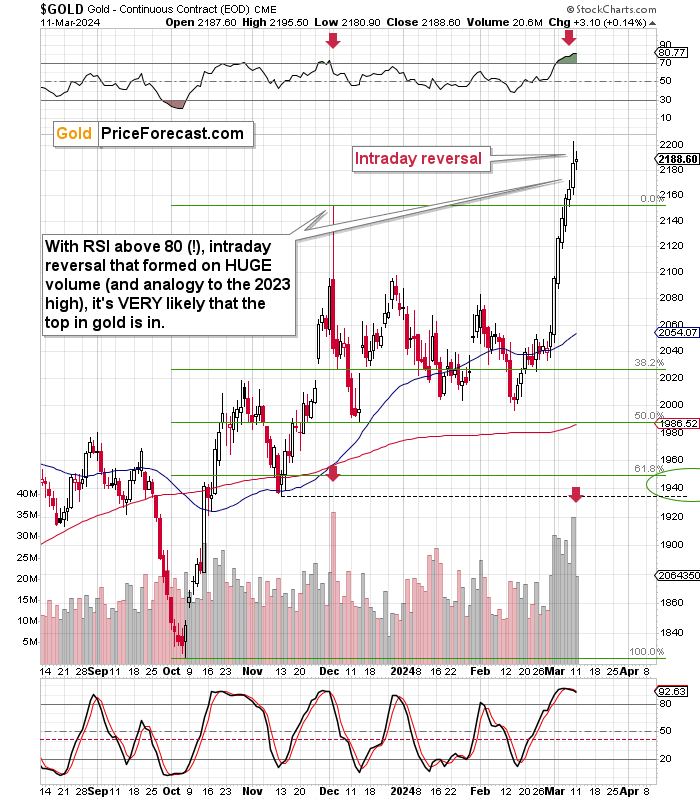
Gold reversed after briefly moving $3 above $2,200. That’s a round number, so it’s important from the psychological point of view. Gold already was in the $2,100s but it was not in the $2,200s – that seemed like an important milestone and gold failed to achieve it.
-
Gold declined after the failed attempt to move above $2,200 and created a bearish shooting star reversal pattern. Those patterns are particularly important when confirmed by huge volume.
-
The volume was indeed huge. This confirms the bearish implications of the shooting star candlestick.
-
The shooting star reversal and huge volume are both like what we saw at the 2023 top, so we have an extremely bearish analogy here.
-
The RSI is not just above 70 – it’s above 80! That indicates an extremely (!!!) overbought situation.
All five points are on top of what I already wrote about gold in yesterday’s big, flagship Gold Trading Alert.
Overnight slide marks significant change
We didn’t have to wait long for the bearish implications to come into play. Gold has been extremely overbought, so it’s perfectly normal that after a brief pause on Monday, gold price is declining today.
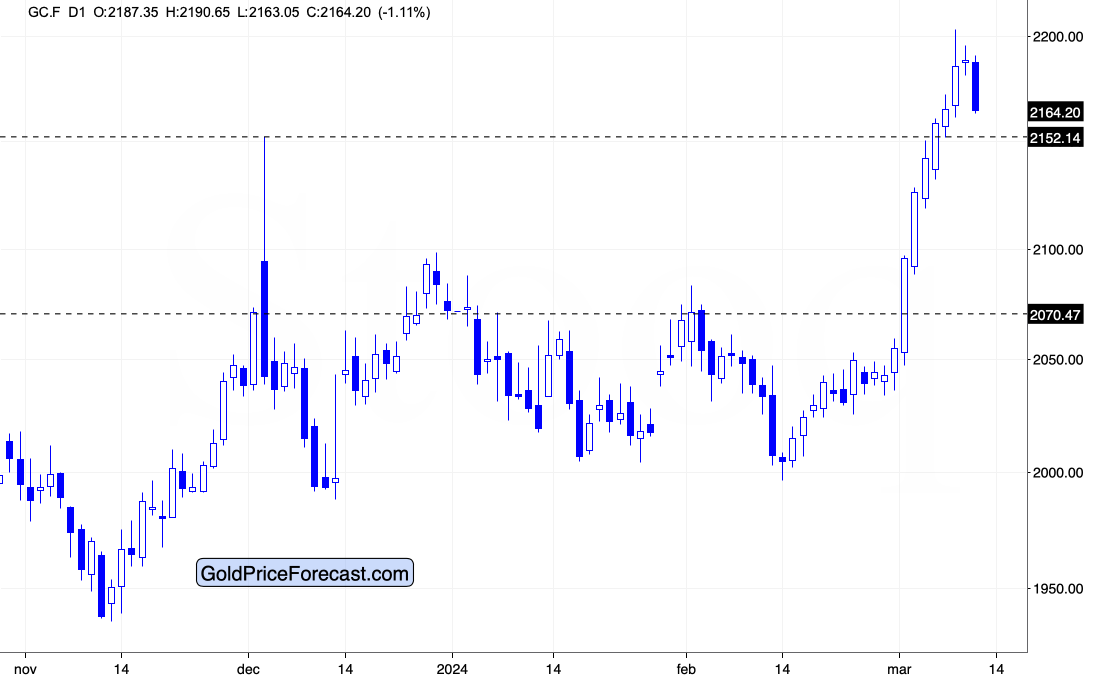
The session is not over, and it hasn’t even started in the U.S. at the moment of writing these words, but what we have seen so far is the biggest overnight decline in gold.
Gold’s inability to move above the perfectly round $2,200 number was one thing, but the shape of the session in which this failed attempt took place was really a screaming sell signal. I wrote about my opinion about a great idea to open a short position in junior mining stocks at that time if one didn’t have it yet (or adding to an existing short position in junior miners).
Please note that gold is now only about $12 above its 2023 high, and invalidating the move above this level will very likely trigger more sharp declines. There was no pause in the recent rally, so there might be no visible pause on the way down. And since fear is a much stronger emotion than greed, the move lower could be really sharp. But you’re prepared.
As gold price is declining, the USD Index is rallying after bottoming at my downside target for it.
Quoting my Thursday’s gold price analysis:
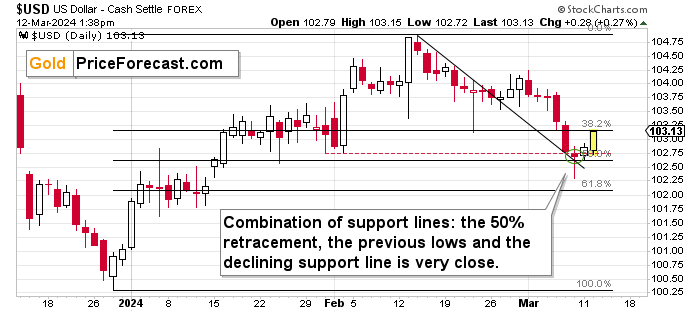
As the USD Index just moved below its late-Feb. low it can now decline even lower – how low? Quite likely to the 102.5 – 102.8 area. That’s where we have the following:
-
The 50% Fibonacci retracement.
-
The previous lows.
-
And the declining support line that was broken in the final days of February.
Before anyone says that the rates might fall in the U.S. and this would make dollar decline, please note that the same thing is the case globally – the ECB just provided the same no-rate-cut-yet-but-sometime-in-the-future narrative. The USD Index is an index that is based on several currency exchange rates, so it’s value is driven by how well the U.S. currency does relative (!) to other currencies. If the situation is bad for the USD but it’s worse for other currencies, the USD Index would be likely to rally, because in relative terms, the USD would be a better choice.
Technically speaking, the USD Index has floor just below today’s lows, so its downside is likely limited. And it’s bottom and the subsequent rally might be the trigger that takes gold lower and that takes our short positions in junior mining stocks to their profit-take levels.
The USD Index just moved even slightly below my target area, reversed in a clear way and now it’s rallying back with vengeance.
As the move above the declining resistance line was verified (it served as support) and the breakdowns below the late-Jan. and Feb. lows as well as the 50% Fibonacci retracement level was invalidated, the outlook for the USDX is bullish.
And since the USDX and the price of gold tend to move in opposite directions, the implications for the precious metals market are bearish. This also means that commodities like copper and crude oil are also likely to now move lower (and Anna’s profits from short position in crude oil are likely to increase).
A likely top in the market
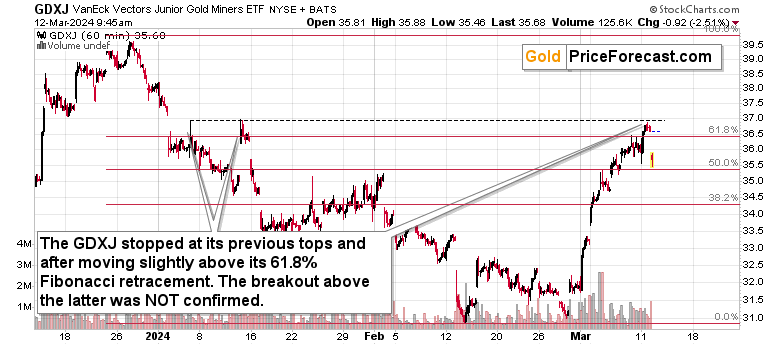
Meanwhile, the junior mining stocks clearly invalidated their move above the 61.8% Fibonacci retracement level.
Quoting my weekend comments:
-
GDXJ reversed on an intraday basis.
-
GDXJ touched its 61.8% Fibonacci retracement level based on the December – February decline – technically what we saw is just a correction within a decline.
-
GDXJ underperformed gold on a daily basis – gold ended the day 0.85% higher while the GDXJ ended the day 0.42% lower (for an apples-to-apples comparison I’m using GLD for this statistic)
-
GDXJ underperformed gold also in the medium term – it’s well below its 2023 high while gold is well above it.
Those indications confirm each other, and they mean one simple thing:
The top in gold and in the mining stocks is very likely in.
I started to write this analysis before the Tuesday’s opening bell, and I was about to write how the breakout above the retracement was not confirmed and that I expected it to be invalidated, but we already saw this invalidation in the first minutes of today’s session.
The top is in.
The best opportunity to enter short positions in the GDXJ (or JNUG) is gone, but the second-best time might be today. Of course, that’s not investment advice aimed at anyone in particular, but in general, the outlook for junior miners is extremely bearish here.
The next step for the junior miners is an invalidation of the move above their mid-Jan. and early-Feb. highs. After this move, I expect juniors to erase their March rally rather quickly. Again, the best time to be prepared for that just passed, but the second-best time is today.
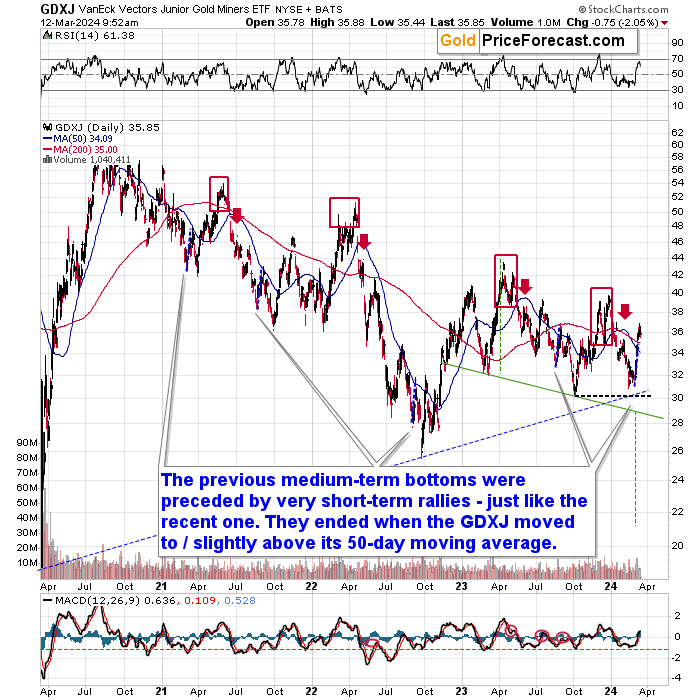
Let’s keep in mind that the gold miners’ recent rally is very much in tune with previous corrections that we saw before the final bottoms. I marked the previous rallies with blue lines, and what we saw recently was only slightly bigger.
The most important thing about the above is what is not written. It was only slightly bigger despite a move to new all-time highs in gold! Miners are remarkably weak here, and this is a huge, flashing, red light that one should NOT ignore.
Want free follow-ups to the above article and details not available to 99%+ investors? Sign up to our free newsletter today!
Want free follow-ups to the above article and details not available to 99%+ investors? Sign up to our free newsletter today!
Author

Przemyslaw Radomski, CFA
Sunshine Profits
Przemyslaw Radomski, CFA (PR) is a precious metals investor and analyst who takes advantage of the emotionality on the markets, and invites you to do the same. His company, Sunshine Profits, publishes analytical software that any


