![]() Denis Joeli Fatiaki
Denis Joeli Fatiaki
Independent Analyst
With gold closing its strongest quarter since 1970 and hitting major resistance at $3,132, markets are at a crossroads. A Head and Shoulders pattern in US 10-year yields signals downside risk, while the dollar falters near resistance as traders brace for Q2 catalysts.
Gold's record-breaking quarter: Safe-haven demand fuels the rally
Gold posted a remarkable 20% gain in Q1 2025, marking its strongest quarterly performance since 1970. This surge reflects a surge in safe-haven demand driven by rising geopolitical tensions, global trade disruptions, and an increasingly uncertain economic outlook. As anticipated in our December 2024 analysis, these macro risks have proven fertile ground for gold's breakout.
The latest bullish leg pushed prices through the $3,034 target and up to $3,132, validating projections from our March 27 update. At the time of writing, gold trades around $3,125, testing the upper boundary of a two-year bullish price channel that began in October 2023. Notably, this latest cycle featured an overlapping rally structure, highlighting intensified demand from institutional and retail investors alike.
Critical decision point: Breakout or pullback?
Historically, each bullish cycle within this channel has been followed by a retracement to its lower boundary. If that pattern repeats, support levels to watch include $3,034, $3,000, and $2,936. The final support that preserves the long-term structure is $2,838—a level where gold consolidated in February. A break below this level would target $2,741, the channel bottom.
However, a break above $3,132 and, more importantly, a hold above $3,158 could trigger a bullish breakout from the price channel, targeting $3,328. Intermediate levels to monitor on the way up include $3,192 and $3,230.
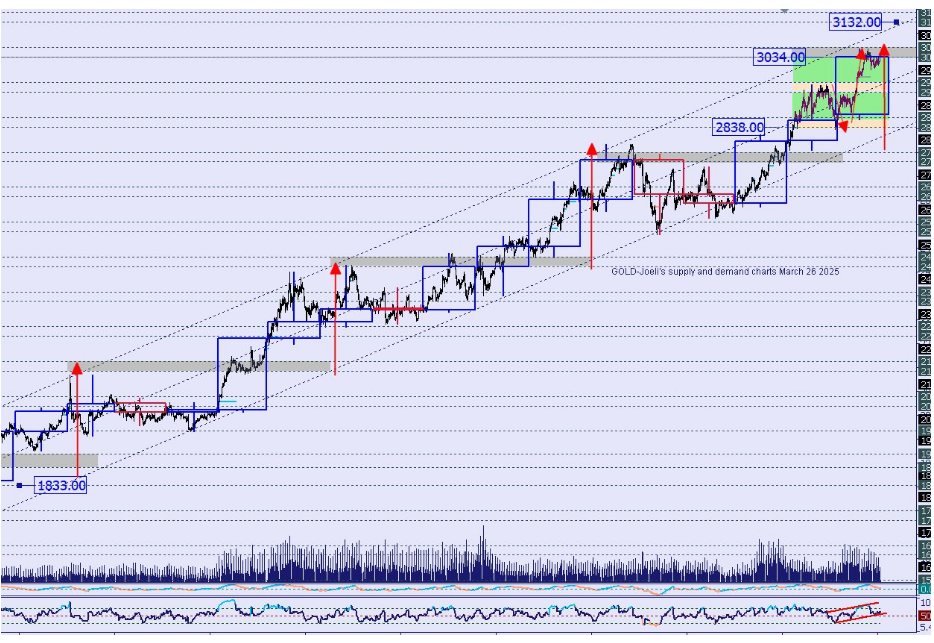
Gold March 26 2025 analysis
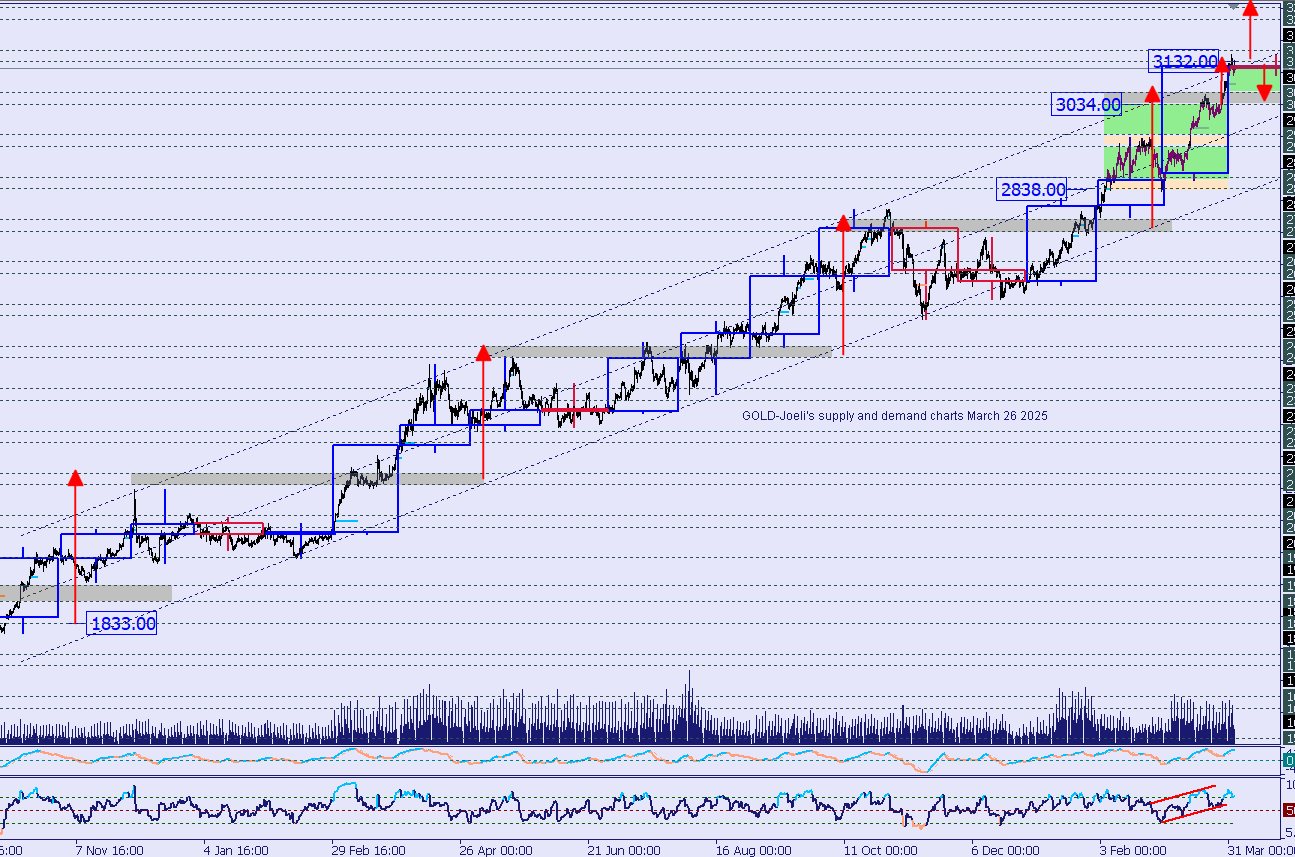
Gold price chart update April 2 2025
US 10-year treasury yields: Head and shoulders at the cliff
The 10-year US Treasury yield (US10Y) continues its descent, now testing the critical 4.16% support level—the last line of defence after failing to sustain a breakout at 4.38%.
Technically, a head-and-shoulders pattern has formed on the daily chart, signaling a potential trend reversal. A confirmed breakdown below 4.16% could open the door to 4.10%, 4.05%, and even 4.00%. This bearish scenario would likely boost demand for gold while putting further pressure on the US dollar.
On the upside, any recovery would encounter resistance at 4.22%, 4.25%, and 4.30%, with a break above 4.30% required to challenge 4.38%–4.40% again.
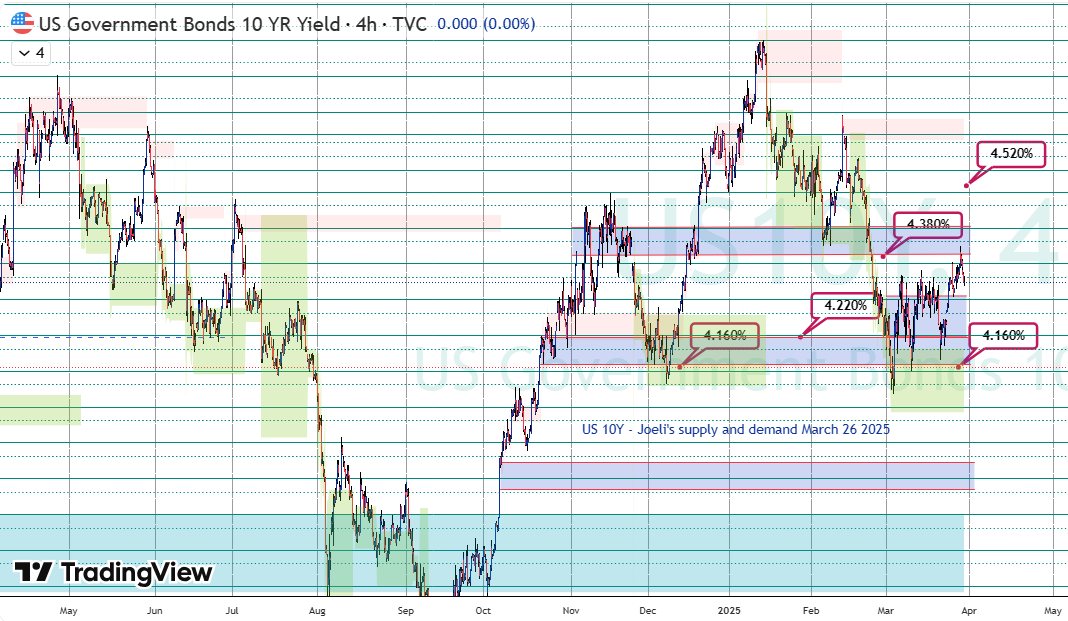
US10Y price chart analysis March 26 2025
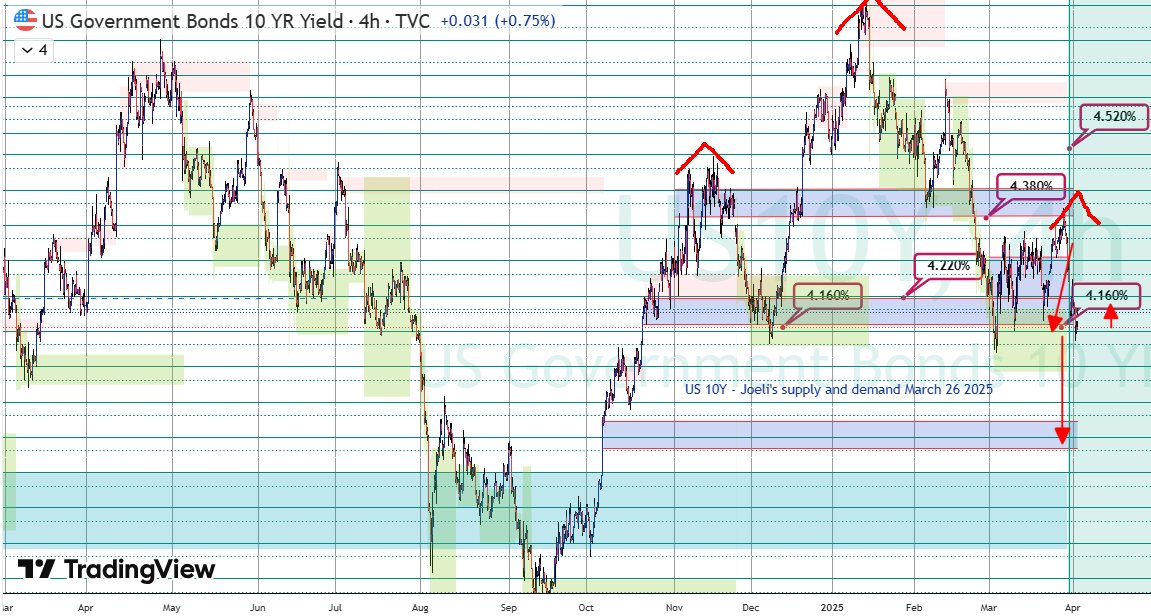
US10Y price chart update April 2 2025
US Dollar Index (DXY): Holding the line or losing momentum?
The US Dollar Index (DXY) fell over 3% in March 2025, posting its worst monthly performance since November 2023. While it bounced from 102.84, the recovery has stalled below 104.00 for three consecutive weeks.
Should gold pull back from current highs, the DXY could stage a short-term rally, targeting 104.46, 105.22, 105.60, and 105.96. Conversely, if gold breaks out above $3,132 and sustains momentum, the DXY may resume its downtrend, retesting 102.84, 102.40, and 102.00.
The dollar's direction in early Q2 will be heavily influenced by safe-haven flows, upcoming CPI data, and expectations around the Fed's rate path.
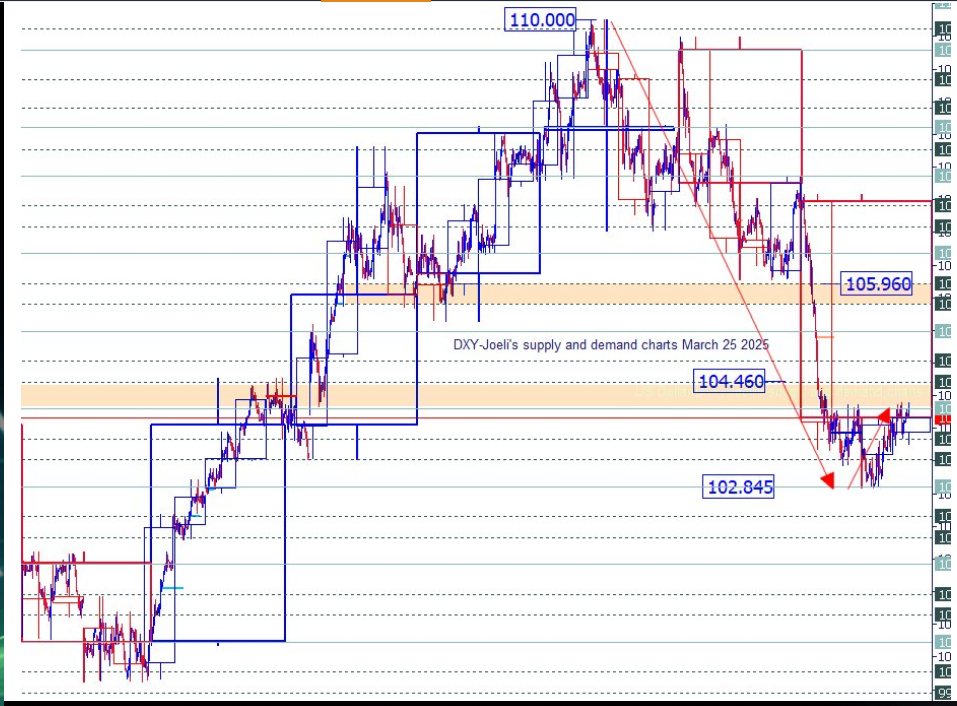
DXY chart analysis March 25 2025
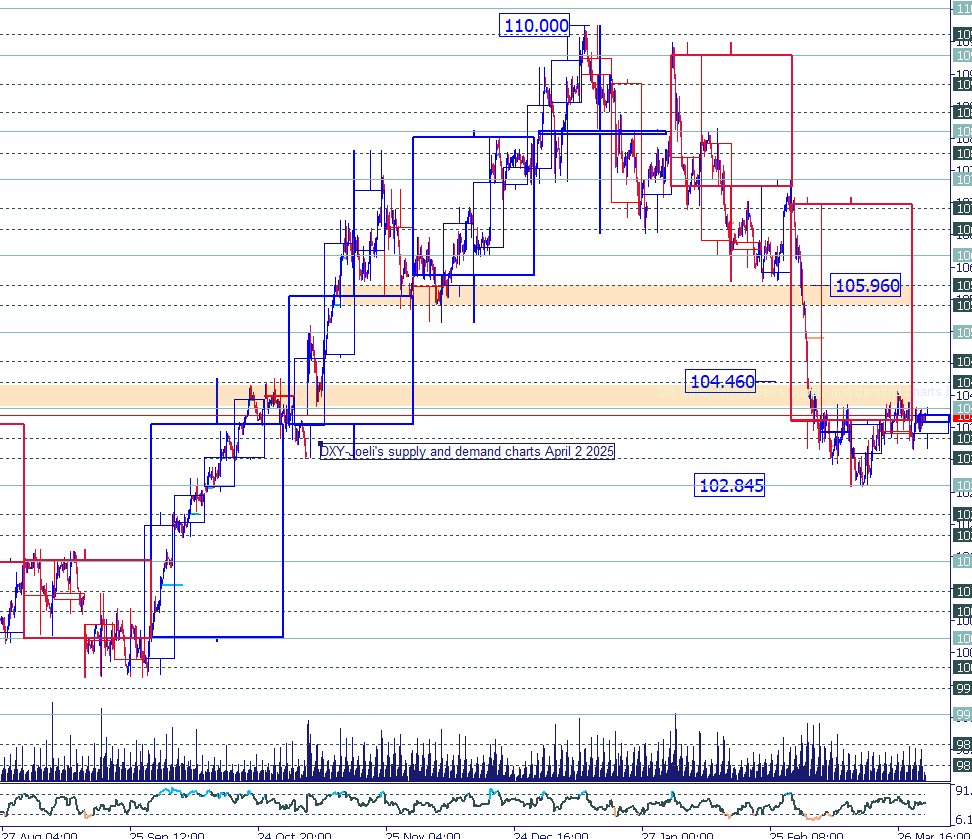
DXY chart update April 2 2025
Key levels to watch in early Q2:
-
Gold support: $3,034 → $3,000 → $2,936 → $2,838 → $2,741.
-
Gold resistance: $3,132 → $3,158 → $3,192 → $3,230 → $3,328.
-
US10Y support: 4.16% → 4.10% → 4.05% → 4.00%.
-
US10Y resistance: 4.22% → 4.25% → 4.30% → 4.38%–4.40%.
-
DXY support: 102.84 → 102.40 → 102.00.
-
DXY resistance: 104.00 → 104.46 → 105.22 → 105.60 → 105.96.
Conclusion: Bulls still in charge, but market tests are coming
Gold's historic Q1 performance sends a powerful message: risk-off sentiment is growing, and investors are rotating toward traditional hedges. With macro risk and central bank uncertainty looming, gold remains favoured—but history tells us that retracements within bullish structures are normal.
Meanwhile, the US10Y yield's Head and Shoulders formation strengthens the case for further downside in yields, especially if 4.16% fails. This would further fuel bullish momentum in gold unless the dollar manages to hold key resistance at 104.00.
Note: All information on this page is subject to change. The use of this website constitutes acceptance of our user agreement. Please read our privacy policy and legal disclaimer. Opinions expressed at FXstreet.com are those of the individual authors and do not necessarily represent the opinion of FXstreet.com or its management. Risk Disclosure: Trading foreign exchange on margin carries a high level of risk, and may not be suitable for all investors. The high degree of leverage can work against you as well as for you. Before deciding to invest in foreign exchange you should carefully consider your investment objectives, level of experience, and risk appetite. The possibility exists that you could sustain a loss of some or all of your initial investment and therefore you should not invest money that you cannot afford to lose. You should be aware of all the risks associated with foreign exchange trading, and seek advice from an independent financial advisor if you have any doubts.
Recommended Content
Editors’ Picks

AUD/USD strengthens as Trump confirms talks with China
The Australian Dollar extends its rally, with the AUD/USD gaining ground as the US Dollar weakens amid growing concerns over the economic impact of tariffs on the United States. Market participants are closely monitoring developments in US trade negotiations, although trading activity is expected to be subdued due to the Good Friday holiday.

USD/JPY weakens below 142.50 as Japanese CPI came in at 3.6% YoY in March
The USD/JPY pair softens to near 142.25 in a thin trading volume session on Friday. The US Dollar edges lower against the Japanese Yen amid concerns over the economic impact of tariffs.

Gold bounces off daily lows, back near $3,320
The prevailing risk-on mood among traders challenges the metal’s recent gains and prompts a modest knee-jerk in its prices on Thursday. After bottoming out near the $3,280 zone per troy ounce, Gold prices are now reclaiming the $3,320 area in spite of the stronger Greenback.

Ethereum ETFs total net assets plummet over 60%; Justin Sun says he won't sell ETH
Ethereum traded just below $1,600 on Thursday following a 60% plunge in the total net assets of US spot Ether ETFs. Meanwhile, Tron founder Justin Sun said that he won't sell his ETH holdings despite the sustained downtrend in the top altcoin’s price.

Future-proofing portfolios: A playbook for tariff and recession risks
It does seem like we will be talking tariffs for a while. And if tariffs stay — in some shape or form — even after negotiations, we’ll likely be talking about recession too. Higher input costs, persistent inflation, and tighter monetary policy are already weighing on global growth.

The Best brokers to trade EUR/USD
SPONSORED Discover the top brokers for trading EUR/USD in 2025. Our list features brokers with competitive spreads, fast execution, and powerful platforms. Whether you're a beginner or an expert, find the right partner to navigate the dynamic Forex market.