Gold’s ready for another wave up

We did it, folks; we shorted the USD Index right at its top – congratulations.
As the situation in the USD Index is playing out as I described it previously, I’m quoting the relevant parts of the previous analysis, and then I’ll add something on top:
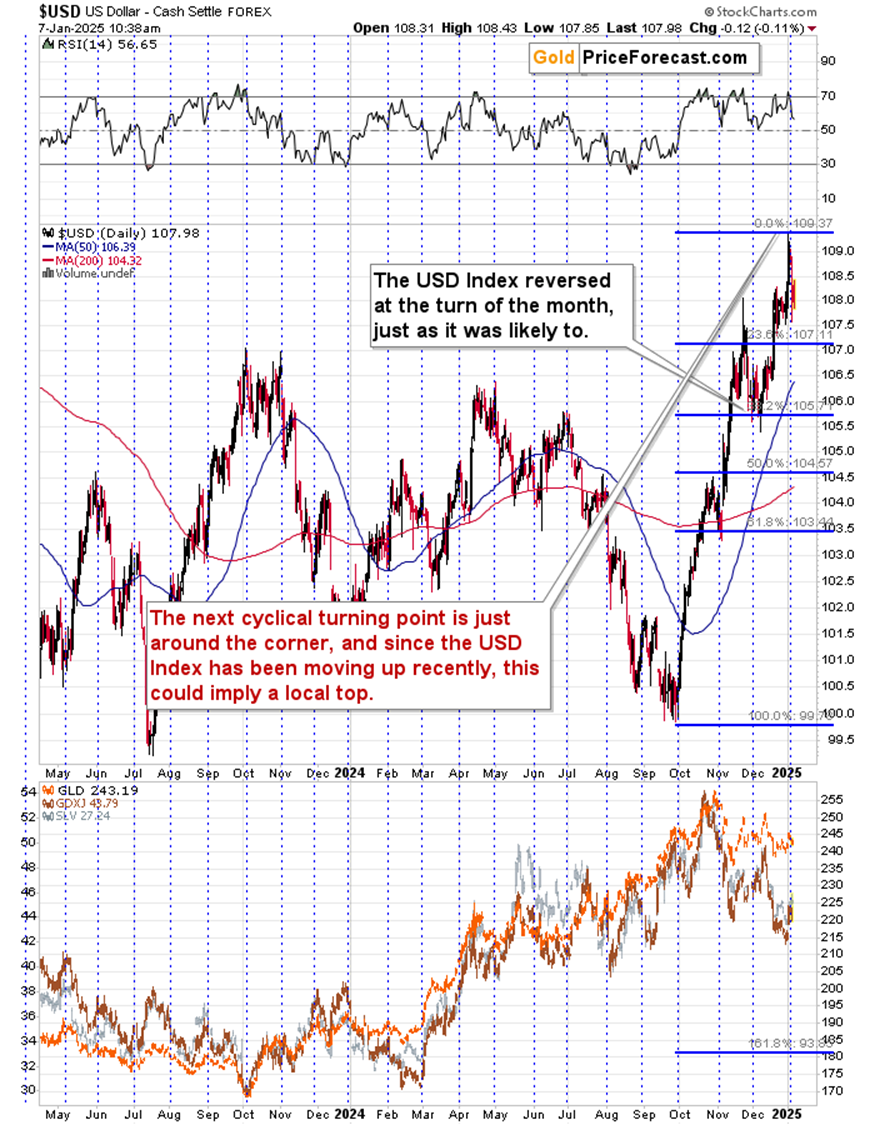
The thing is that the USD Index invalidated its move above the 61.8% Fibonacci retracement level. As I had written previously, this was likely to happen as the USD Index rallied too much too quickly, which took daily RSI (visible on the below chart) above 70, and we had the monthly turning point.
The invalidation of the move above 61.8% retracement is no small feat. This is a key, classical retracement, obvious to everyone analyzing the charts. The decline that it’s based on is also really important. Consequently, what we see now is likely to trigger sales by many technical traders and take the USD Index lower in the short term. As a reminder, I continue to think that the USDX is likely to rally in the medium term, but I also think that it’s going to correct this month – likely to its 38.2% Fibonacci retracement level, which tends to be the default target for corrections during strong rallies. And as the USDX declines, gold, silver, and mining stocks are likely to move higher.
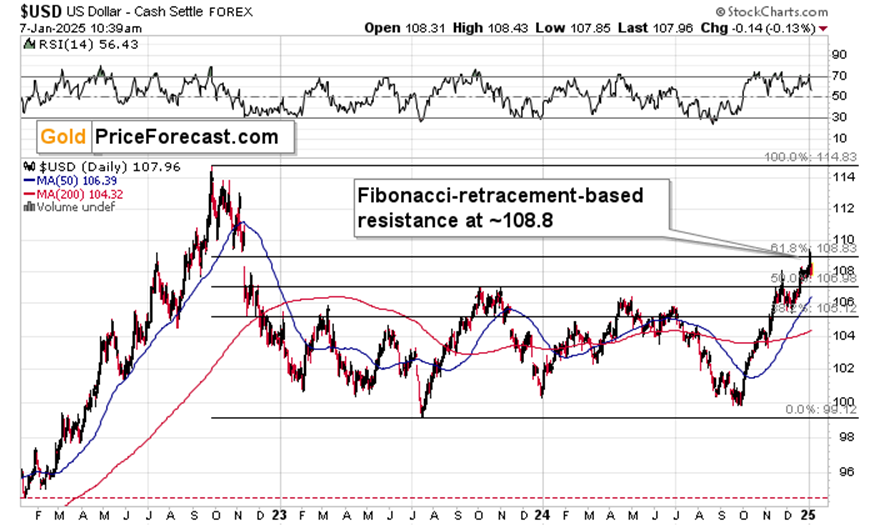
Alternatively, the USD Index could correct to the 23.6% Fibonacci retracement, which would confirm that this is not just a strong rally in the USDX but a very strong one. This retracement is at about 107.1, which aligns with the 2023 highs. So, if the USD Index is close to this level and is showing signs of strength (e.g. intraday reversal(s)) while gold and miners are at their own upside targets or close to them, I’d likely write about taking profits from the current long trades in the latter (and the short position in the USDX).
The thing that I would like to add is the really big picture.
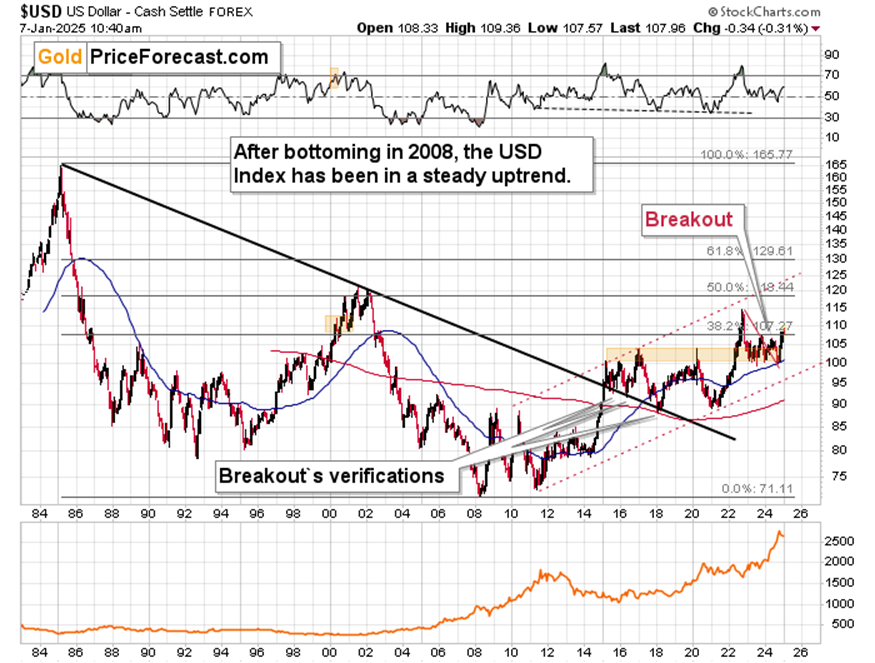
The USD Index is after a long-term breakout that was then verified. Right now, the USD Index broke above its 38.2% Fibonacci retracement level based on the 1985 (yes) – 2008 decline. This is the second attempt for the USD to move above it, and if the decline stops at 107 or close to it, we can view this breakout as being confirmed. Actually, given how big the timeframe here is, I think it would be fair to view only a bigger move below 107 that lasts for longer (at least a week) as an important invalidation.
The key point here is that the big trend remains up. The next strong resistance is in the 118 – 120 zone as that’s where we have the 2001 high and the 50% Fibonacci retracement level based on the huge 1985 – 2008 slide.
I’m writing all this to show you that the upside target that might seem ridiculously high from the short-term point of view (like 120), is something very normal from the very long-term point of view. And let’s keep in mind that when implications of two charts are in conflict, it’s usually the one of more long-term nature that ends up winning the quarrel.
Gold's trajectory: Support holding firm
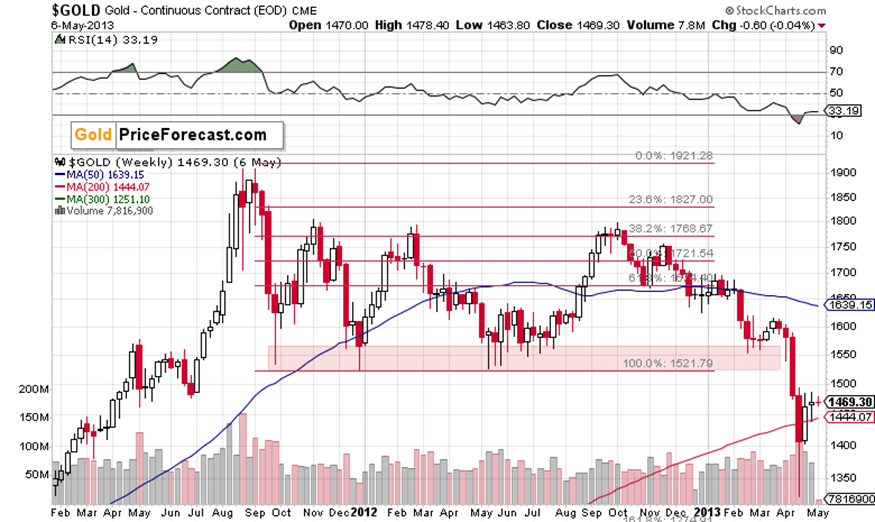
Moving on to gold, we see that the yellow metal declined back to the lower border of the triangle and then it moved back up.
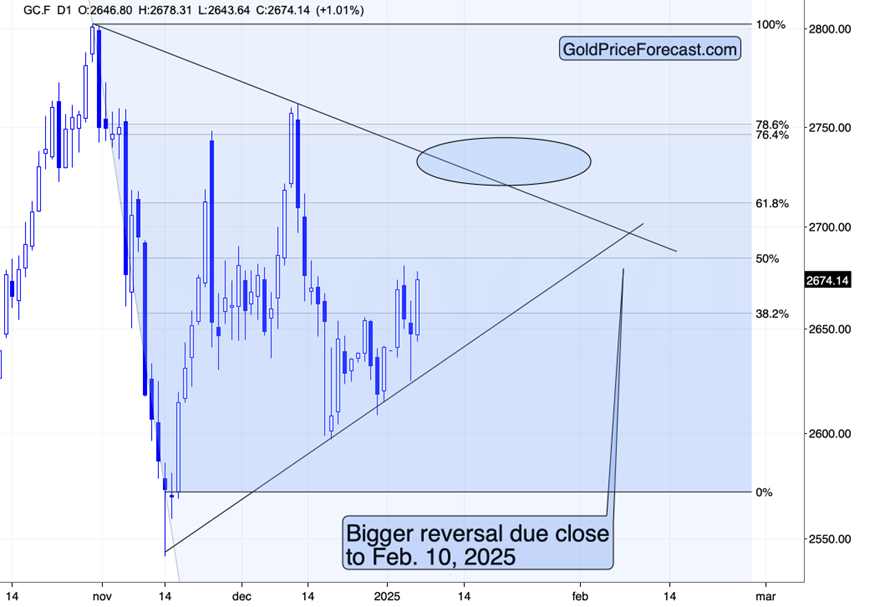
The support held, suggesting that higher gold prices are likely. My best bet (or rather a technical estimate) is still the $2,730 - $2,745, depending on when gold reaches it. As I wrote yesterday, this would make sense not only from the current technical point of view, but also based on the analogy to how gold moved back and forth before the slide in 2012 and 2013.
I previously described it in the following way:
Does this rally weaken the bearish case for the following months? Not at all. Please remember that the entire 2012-2013 pre-slide trading pattern was back-and-forth movement within a rather broad trading range. There were four distinct tops then – perhaps we’re seeing exactly the same thing right now and this rally will take gold to its fourth – and final – top.
So, just as I wrote yesterday, I think that it was worth it to adjust the trading position for this kind of correction. If the outlook was less bullish, I would most likely keep the short position intact and plan to wait out the correction. However, the upside seemed big enough for the above-mentioned adjustments (taking profits from the short positions and going long).
We see some interesting technical developments in silver and copper as well.
In yesterday’s analysis, I wrote the following:
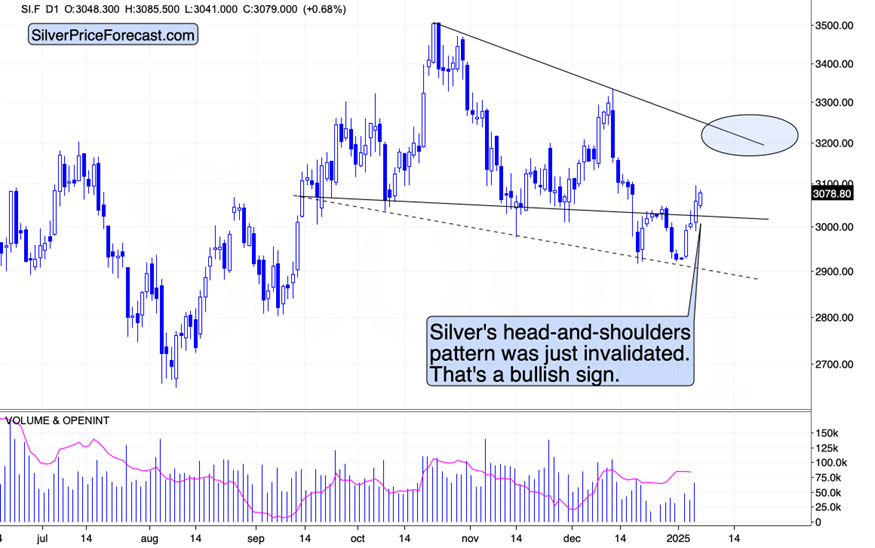
Silver price is once again above the $30 level and while I don’t think this will hold, it’s likely to trigger another rally, which could eventually take silver up to the $32.50 level.
Right now, silver is trying to verify (or invalidate) its head and shoulder top pattern. For now, the jury remains out – at least as silver price action is concerned on its own.
However, since no market moves on its own, and silver will likely respond to USDX’s movement, it seems that silver will move higher from here in the short run.
Indeed, it moved higher, and it also invalidated its head and shoulders pattern, which in turn served as yet another bullish sign. This fits the scenario, in which the USD Index declines some more.
Copper's signal: A bullish outlook
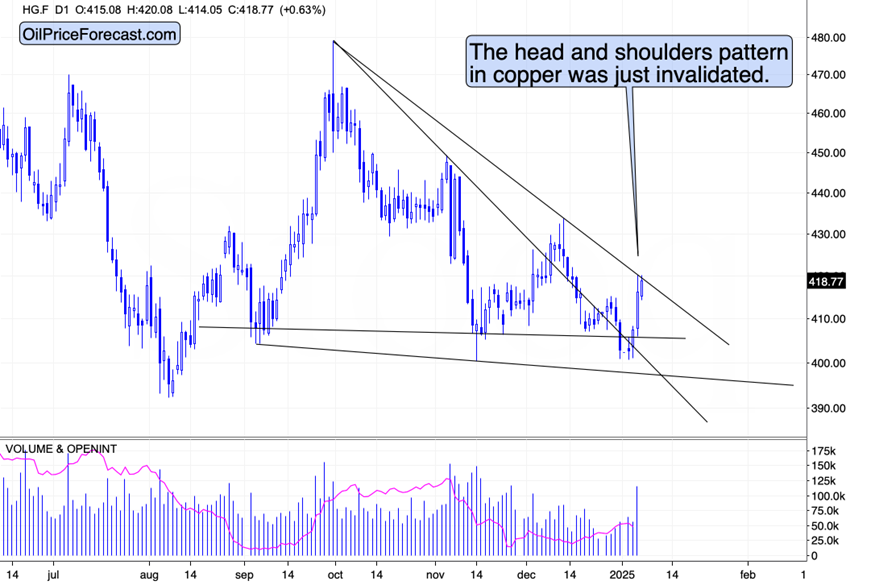
Yesterday, I also wrote about copper. The latter served as the canary in the coal mine – it was the first asset to invalidate its H&S pattern and what I had expected, became the reality:
Interestingly, copper already invalidated its breakdown below its head and shoulders pattern in terms of the daily closing prices. Since copper often moves in tune with the precious metals sector, this is a bullish sign - not just for copper, but also for gold, silver, and mining stocks.
So, what does it all mean? It means that the precious metals sector is likely to move higher in the near term, and the same goes for copper. Yes, the latter encountered a declining resistance line right now, but since it’s been so highly (and negatively) correlated with the USD Index, I still think that another move lower in the USDX will trigger another move higher in copper.
Please note that just as the December rally took copper above its declining resistance line that was in place back then, we can have the same thing right now, and it could be followed by the same kind of action. Another wave lower. In fact, this is the likely outcome in my view. The rallies in PMs, miners, and copper, just as the rally in the USD Index are corrections, not the main, medium-term moves in those markets.
Want free follow-ups to the above article and details not available to 99%+ investors? Sign up to our free newsletter today!
Want free follow-ups to the above article and details not available to 99%+ investors? Sign up to our free newsletter today!
Author

Przemyslaw Radomski, CFA
Sunshine Profits
Przemyslaw Radomski, CFA (PR) is a precious metals investor and analyst who takes advantage of the emotionality on the markets, and invites you to do the same. His company, Sunshine Profits, publishes analytical software that any


