Gold’s quick reversal and Copper’s major indications

Copper is definitely the most important industrial metal out there.
Freeport-McMoRan reflects market trends
In the entire commodity sector, only crude oil is more widely used. And given the increasing importance of all-things-electronic, copper is unlikely to be forgotten anytime soon. This doesn’t mean that the only way in which its price can move is up (far from it), but it does indicate that this market is likely linked to multiple other markets – also to gold price.
Before showing you the copper chart, I’d like to show you one of its producers – the Freeport-McMoRan (FCX) share price, which behaves very specifically at major tops in stock markets around the world. No wonder – with lower demand for copper (FCX reflects that as well as the overall approach of investors toward copper and the stock market in general), we get lower copper prices. But lower demand for copper also indicates fewer orders for goods (producers order less as they don’t need to produce as much), which is a sign of lower industrial production and a weaker economy overall.
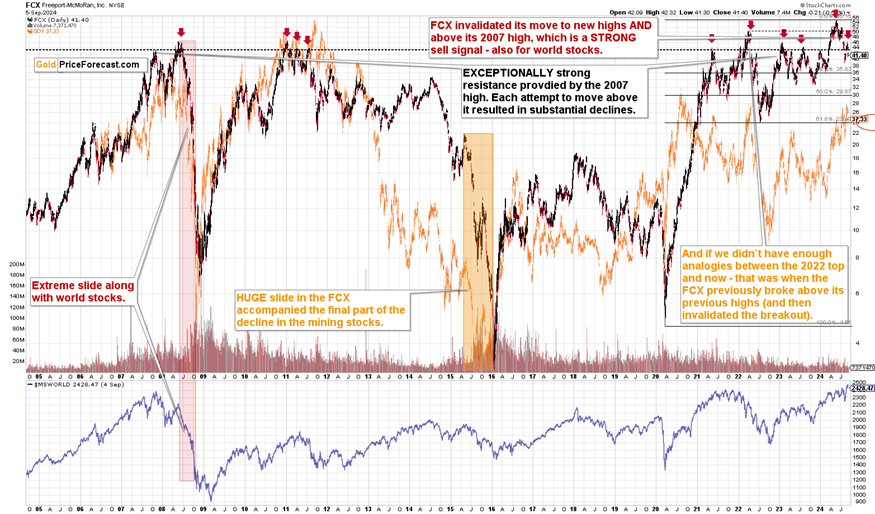
FCX formed a major top in 2007. It was major not because it was not broken. It was. What is remarkable is that each time FCX price exceeded this top, it then invalidated this breakout either shortly or eventually. I marked those cases with red arrows on the above chart.
It’s remarkable how strong the top from many years before worked as an impenetrable (at least not on a sustainable basis) barrier for FCX, isn’t it? Food for thought for everyone writing every now and then that something from a more distant past can’t affect the current prices as it was taking place (here: the 2007 top) under different economic conditions, with different geopolitical environments etc.
If you focus on the bottom part of the chart, you’ll see the performance of world stocks. Yes, it was mostly the U.S. stock market that’s been soaring in the recent years, but in the case of the rest of the world, we (on average) saw nothing more than a comeback to the 2007 top.
Please consider what happened in world stocks each time when the FCX topped and then invalidated its breakout above the 2007 high. Those were the times when the top was either in or when a broader top was starting or ending to form.
The 2008 top… Well, we all remember all too well what kind carnage happened then – also in the precious metals sector.
The 2011 top was broad and… It was followed by major top in the precious metals sector.
The tiny 2021 invalidation was early in the topping process in world stocks, but given the size of the following decline, one could say that it was indeed very close to the top. The early 2022 invalidation confirmed the sell signal. Also, both invalidations marked tops / shorting opportunities in gold stocks, which you see (GDX) in the background of the main chart (marked with orange).
The 2023 invalidations resulted in just a small decline, but it still happened – also in case of gold stocks.
Then comes this year – we saw two invalidations of the move above the 2007 high. The first one was also a failure to hold at new all-time highs, and the second one happened very recently. World stocks are after a broad consolidation pattern, at their previous highs, which looks just like a broad top that we saw in 2021 and 2022, which means that the recent invalidation was just like the final sell signal that we saw in early 2022 (compare with what I marked with bold above).
This is a major (with implications for weeks and months, not necessarily days or years) sell signal for both: stock markets around the world and gold stocks. And, of course, FCX itself.
On a side note, if one shorted FCX within the last few of months, it seems that they are quite happy with that choice.
Given the prices of world stocks, we’re in a situation that’s similar to the 2007 and 2022 tops (already after them). And this is profoundly bearish for mining stocks.
Looking at copper itself, we see something similar (although not as precise, which is why I started with FCX).
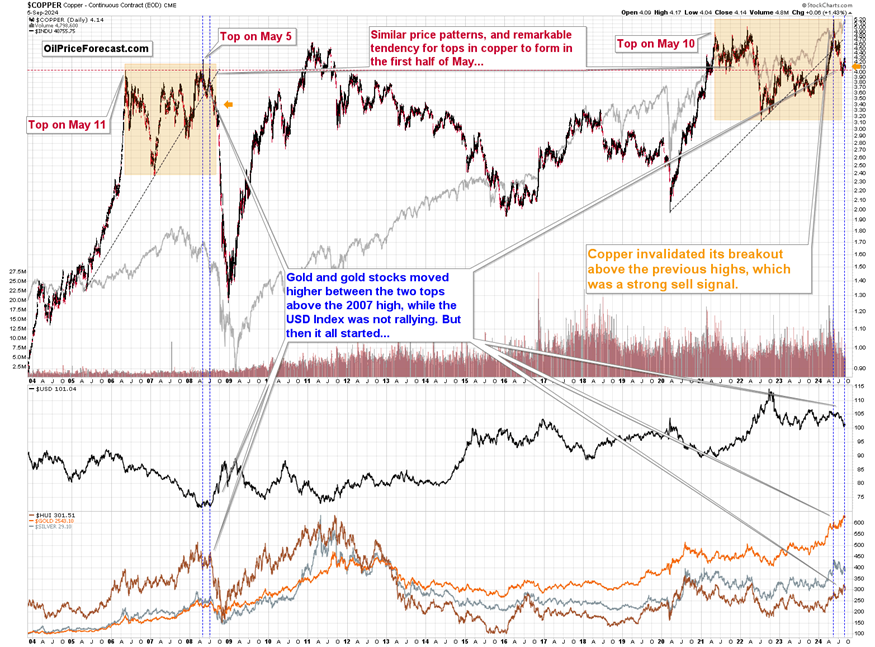
After topping in May (just like I had warned) and invalidating the move to the new all-time high, copper plunged.
On the above chart, we can see a similarity of the entire broad pattern that I marked with orange, which is additionally confirmed by the breakdown below the rising, dashed support/resistance lines.
Echoes of 2008: Major declines ahead?
Back in 2008, there were two attempts to move above the previous (2006) high in copper. The first one was a move to an all-time high, and the second one was lower. It was after a medium-term decline in the USD Index, and in general, gold and gold stocks moved higher between those tops in copper.
We have the same thing today with regard to the same (2006) top. It might be difficult to believe, so I marked it with a horizontal dashed line. Copper’s all-time high was followed by a decline back below the 2006 high, and the recent run-up just took copper slightly above it. The USDX is after a medium-term decline. Gold and gold stocks moved higher between the tops in crude oil.
What’s next based on this link? Back in 2008, a massive decline followed, so the implications are – of course – very bearish for all those markets – including world stocks.
Again, this move lower doesn’t have to materialize in the next few days and it’s unlikely to last for years, but I do expect to see lower prices in terms of weeks and months.
And as we see this medium-term move lower, I continue to expect junior mining stocks to perform particularly well, and by well, I mean that they would be particularly weak, providing great profits from short positions in them.
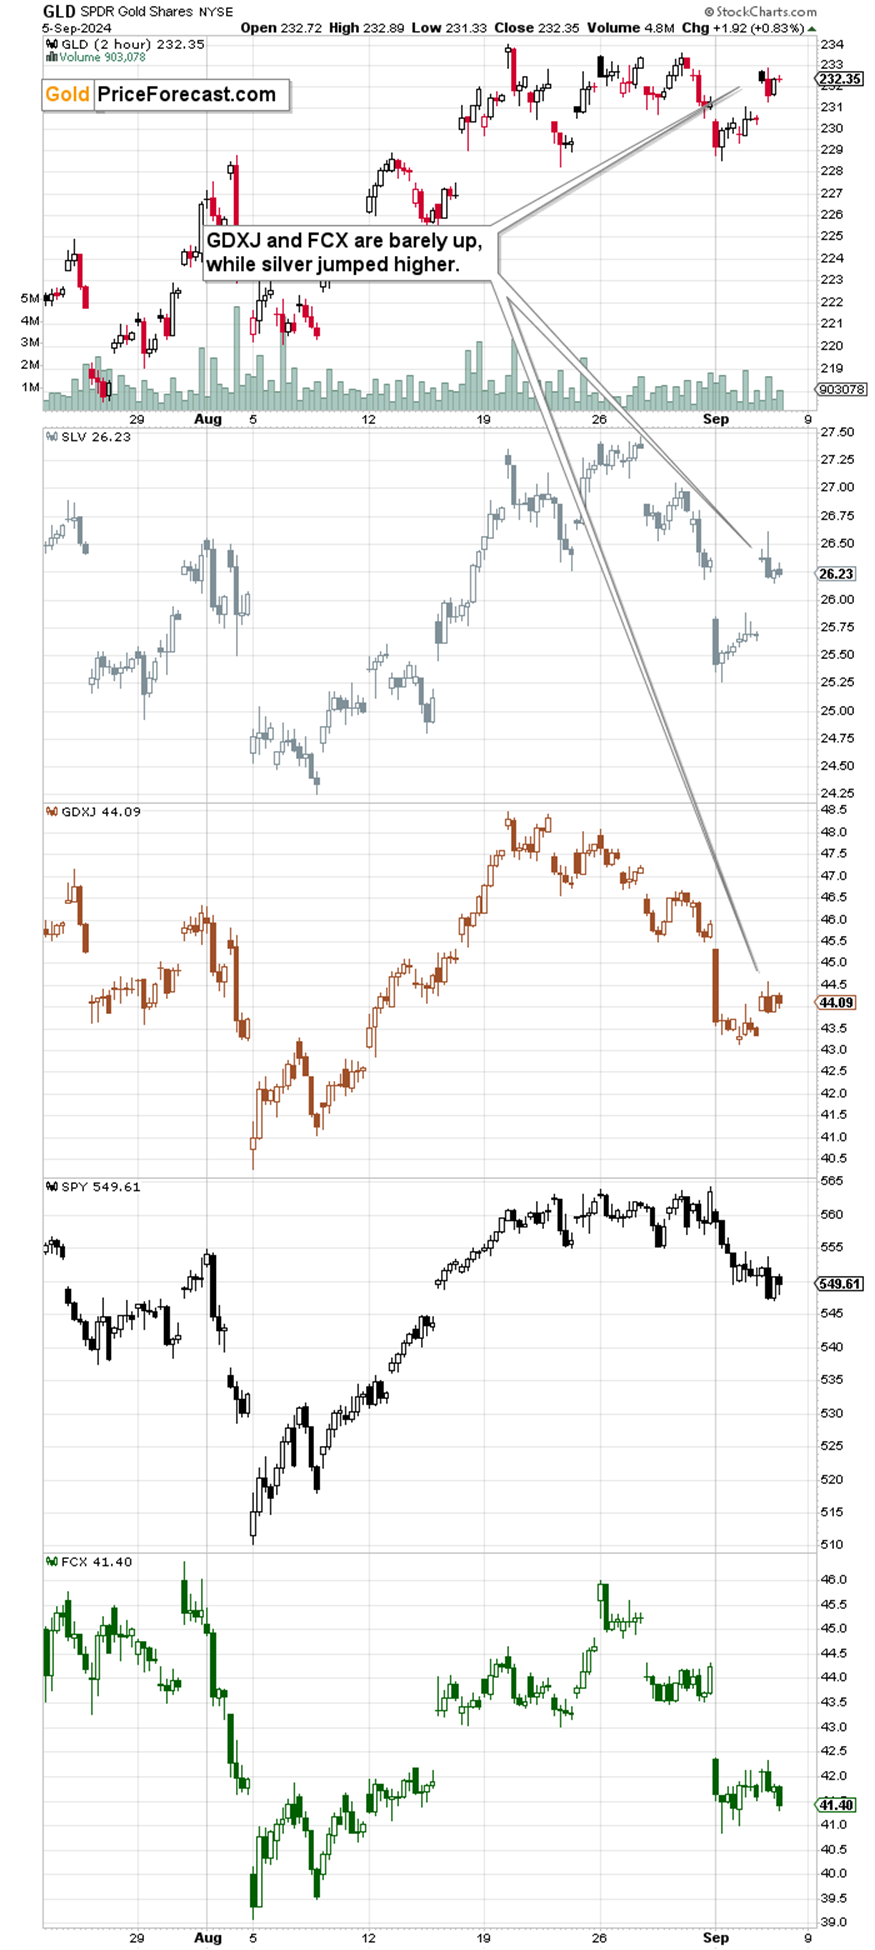
The above chart shows that the GDXJ was barely up yesterday (while gold and silver moved visibly higher), and FCX actually declined by 0.5%.
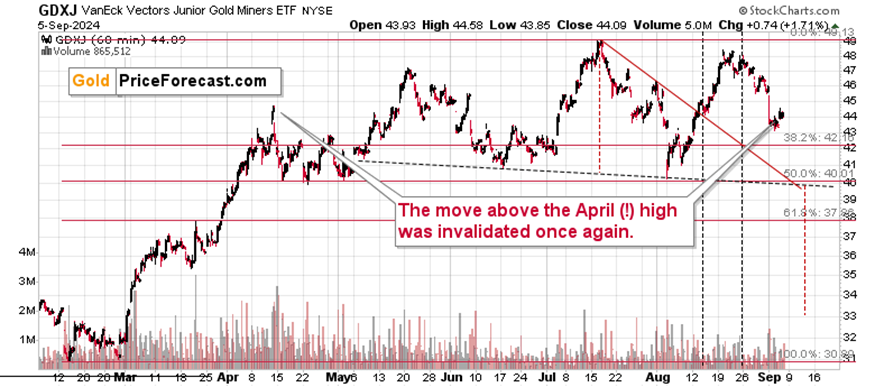
On a very short-term GDXJ chart, we see that yesterday’s “rally” was just a blip on the radar screen – nothing to write home about.
Please note that the red declining support line and the dashed support line as well as the 50% Fibonacci retracement intersect at about $40 on Tuesday / Wednesday. If the GDXJ moves there, we might get some kind of rebound.
On an immediate-term basis, we saw a quick jump up in gold after the nonfarm payrolls were released which was followed by another move lower. At the moment of writing these words, it’s still before the opening bell (about 22 minutes), and gold is down by $2.50. This reversal has bearish implications as it shows that the bearish overwhelmed excited buyers. And it makes the scenario from the previous paragraph (decline today and/or early next week) quite likely.
Want free follow-ups to the above article and details not available to 99%+ investors? Sign up to our free newsletter today!
Want free follow-ups to the above article and details not available to 99%+ investors? Sign up to our free newsletter today!
Author

Przemyslaw Radomski, CFA
Sunshine Profits
Przemyslaw Radomski, CFA (PR) is a precious metals investor and analyst who takes advantage of the emotionality on the markets, and invites you to do the same. His company, Sunshine Profits, publishes analytical software that any


