Gold's Q1 2025 surge, can the record run continue?
-
Gold's journey beyond the 3,000 mark.
-
Interest rate cuts likely fueling gold's surge.
-
Is it time for a downside correction?

In the first quarter of 2025, gold prices have shown steady growth due to several factors. Persistent inflation is reducing the value of currencies, prompting investors to turn to gold as a hedge. Unpredictable stock markets have made gold a stable choice for many. Global conflicts and trade disputes have increased demand for safe-haven assets like gold. Central banks have continued their record-setting gold purchases from 2024 into 2025. Additionally, any signs of a loosening in monetary policy or cuts in interest rates can boost gold prices. Overall, gold remains a key asset for diversification and wealth preservation, with analysts projecting continued strength throughout the year.
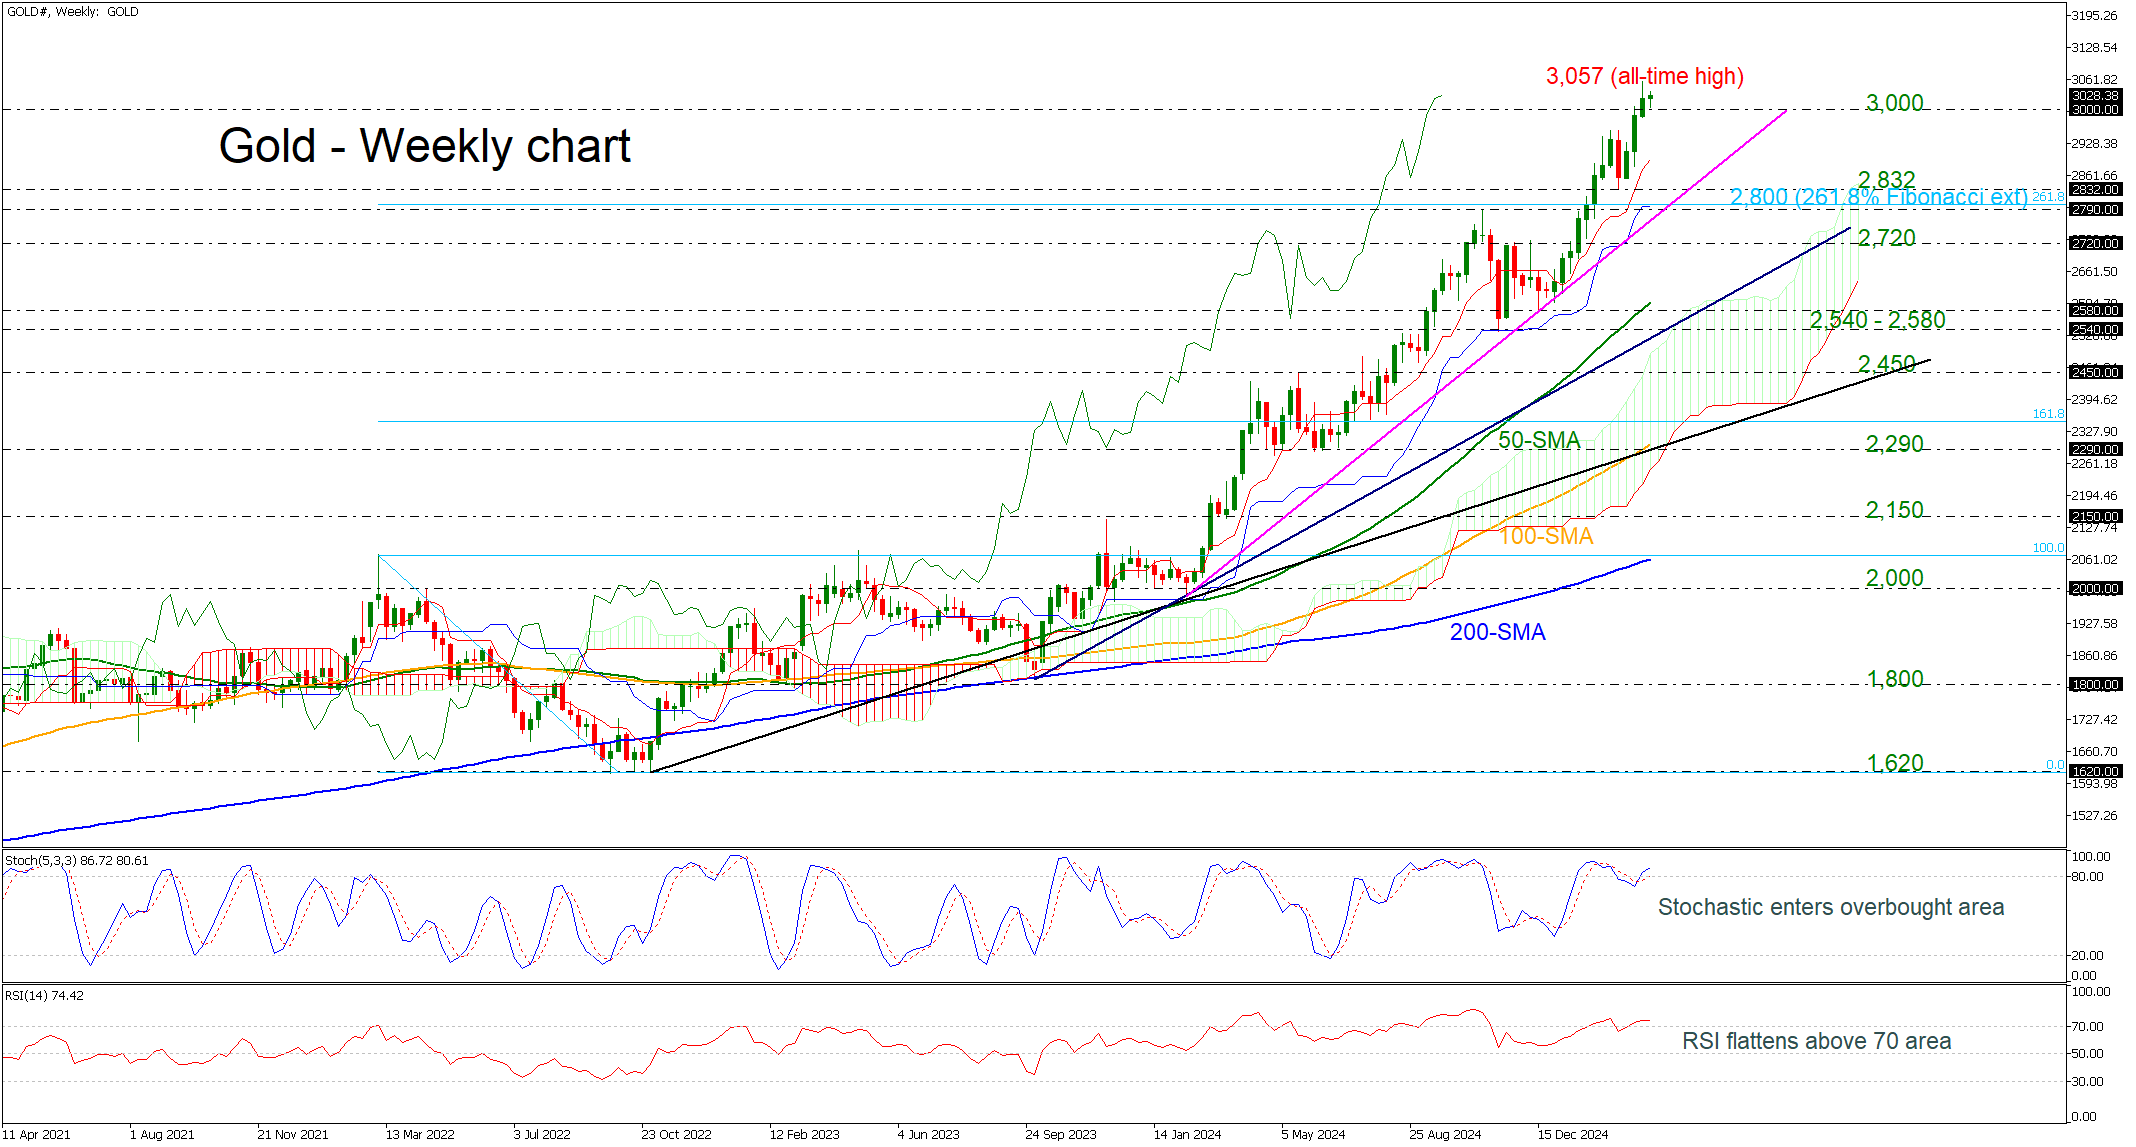
From a technical standpoint, the precious metal entered the 3,000 critical level at the beginning of March, skyrocketing to 3,057 on March 20. The price is still holding above the psychological mark, remaining in a steep upside tendency since February 2024. More increases may send investors toward uncharted levels again, reaching the next round numbers such as 3,100 and 3,200. Even higher, the 423.6% Fibonacci extension level of the down leg from the peak in March 2022 to the lows in September 2022, slightly above 3,500, could attract traders’ attention.
On the other hand, a slide below the 3,000 level could open the way for a bearish correction, with the first support coming from the one-year uptrend line around the 2,832 barrier. Marginally lower, the 2,800 mark and the 2,720 level may halt negative movements before penetrating the diagonal line from October 2023.
The momentum oscillators indicate a potential downside retracement in the market as both are weakening their move. The stochastic is slowing in the overbought region, while the RSI indicator is moving horizontally above the 70 area. However, the price is still standing well above the Ichimoku cloud.
As long as the market trades above the ascending trend lines and the simple moving averages (SMAs) in the weekly chart, the longer-term outlook is strongly bullish. Only a plunge below the 200-week SMA and the 2,000 handle may switch the picture to bearish.
Author

Melina joined XM in December 2017 as an Investment Analyst in the Research department. She can clearly communicate market action, particularly technical and chart pattern setups.


