Gold Elliott Wave technical analysis [Video]
![Gold Elliott Wave technical analysis [Video]](https://editorial.fxstreet.com/images/Markets/Commodities/Metals/Gold/gold-nuggets-14424039_XtraLarge.jpg)
Gold Elliott Wave analysis
Gold Elliott Wave Analysis: Strong Rally with More Upside Expected.
Gold has broken out of its 3-week range and surged to a new record high, continuing its highly profitable run for investors in 2024. Since ending a prolonged 51-month bearish phase from the September 2011 peak in September 2022, the yellow metal has appreciated nearly 60%. This impressive rally shows no signs of stopping in the short term, but traders should be cautious about entering new positions at elevated levels. Here's a detailed analysis from an Elliott Wave perspective.
Long-term chart analysis
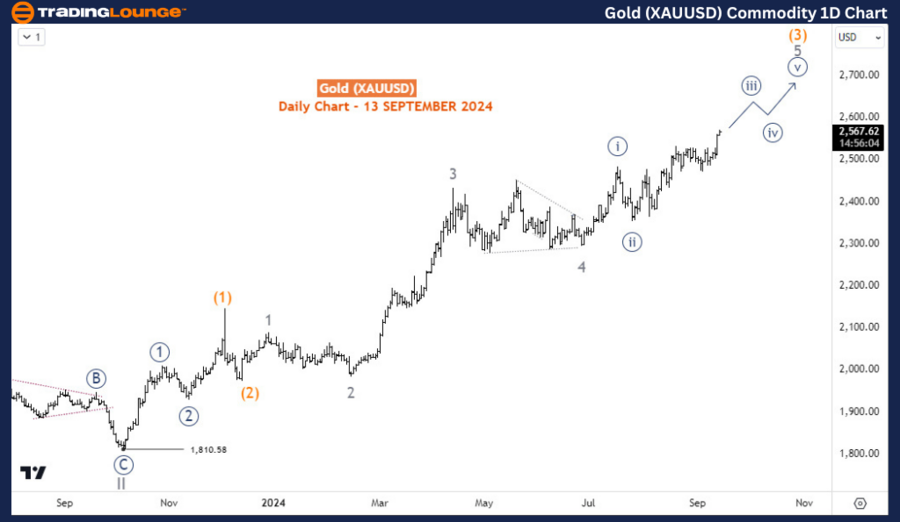
On the daily chart, Gold has been in a steady bullish trend since December 2015. According to Elliott Wave theory, the market completed the supercycle degree wave (IV) in September 2022. This marked the end of the 51-month bearish phase that started in September 2011. The completion of wave (IV) set the stage for a new impulsive wave (V), which is currently unfolding.
Within this wave (V), waves I and II were completed in May and October 2023, respectively. Gold is now progressing in wave (3) of 3 (circled) of wave III. Wave (3) is a powerful impulse wave that is driving prices higher, and it is currently in its final stage, labeled as wave 5 of (3). This final leg of wave (3) is also forming an impulsive structure, indicating that the bullish momentum remains strong.
The strength of the current uptrend suggests that traders should consider buying pullbacks, as these dips could offer attractive entry points for long positions. Long-term investors can also continue to hold, as the broader trend remains firmly bullish, and there is potential for more upside.
Daily chart analysis
From a closer look at the daily chart, the ongoing advance in wave (3) is part of a larger impulsive structure. Wave (3) of 3 (circled) has been particularly strong, and within this wave, the final phase (wave 5 of (3)) is approaching completion. This suggests that while the uptrend is intact, the market may soon face a period of consolidation or a minor corrective pullback before resuming its upward trajectory.
For now, Gold is likely to continue its advance toward new highs. Traders should focus on timing their entries during pullbacks to maximize profit potential, while long-term buyers are advised to stay the course and hold their positions as wave (V) continues to unfold.
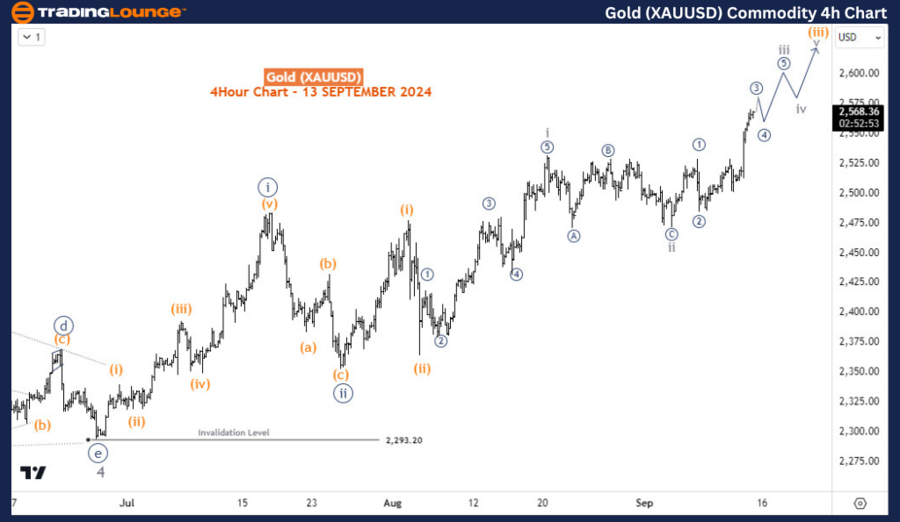
Four-hour chart analysis
On the H4 chart, the structure of wave 5 of (3) is more clearly visible. The sub-waves that comprise this final phase started forming in late June 2024. At this point, waves i and ii (circled) within wave 5 of (3) have already completed, and Gold is currently advancing in wave iii (circled).
Zooming further into wave iii (circled), we can see that the price is in wave iii of (iii), which is often the most powerful part of an impulse wave. This sub-wave is expected to drive Gold toward the 2750 level in the coming weeks. However, traders should avoid buying from current highs, as entering at the top of a strong rally could expose positions to near-term pullbacks. Instead, waiting for decent corrections will offer better entry opportunities for long positions.
Conclusion
Gold remains in a strong bullish trend, with the Elliott Wave structure suggesting further upside potential. The market is advancing in wave (3) of 3 (circled) of wave III, with the next major target being around the 2750 level. While the trend remains robust, traders are advised to wait for pullbacks to enter new long positions rather than chasing the current highs. Long-term investors can maintain their positions, as the broader outlook continues to favor further gains.
Gold (XAU/USD) Elliott Wave technical analysis [Video]
Author

Peter Mathers
TradingLounge
Peter Mathers started actively trading in 1982. He began his career at Hoei and Shoin, a Japanese futures trading company.


