Gold Elliott Wave analysis: Trapped in a range – Where will it break out?

Function - Counter-trend.

Mode - Corrective.

Structure - Zigzag.

Position - Blue wave D of IV.

Direction - Blue wave E of IV.

Gold has exhibited a consolidated phase spanning the last three months, indicating a period of range-bound movement. However, this consolidation does not disrupt the overarching long-term trend that has persisted since 2015. Anticipation mounts that once gold breaks free from this range, it may surge to establish a fresh all-time high, thus reinforcing its enduring bullish trajectory.

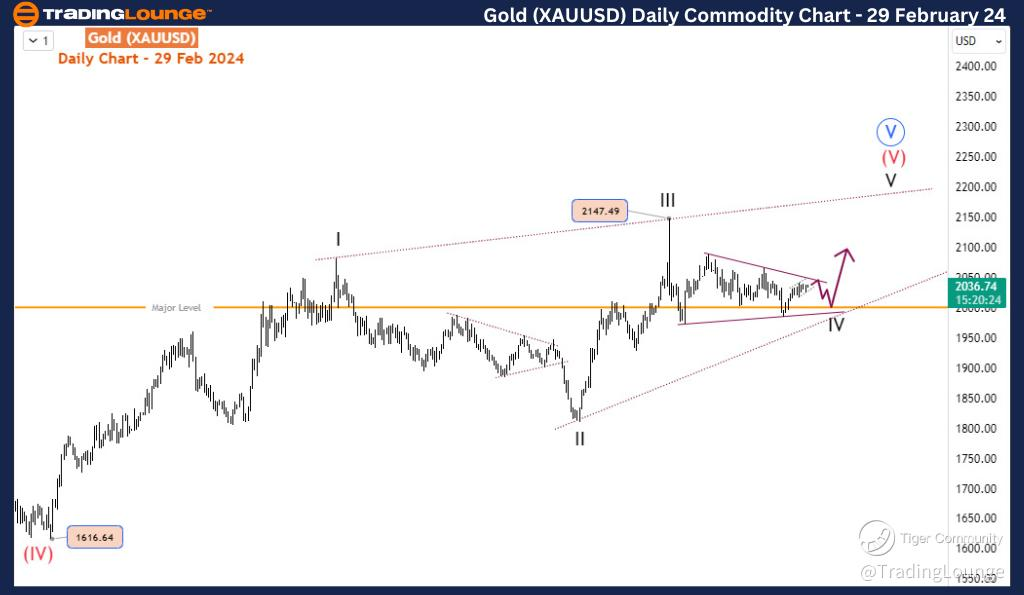
Zooming into the daily time frame, scrutiny intensifies on the unfolding dynamics of the red wave (5) within the larger context of blue wave V. Commencing its development from 1616 in November 2022, wave (5) appears to be manifesting into an ending diagonal pattern. While wave I-II-III of (V) have seemingly concluded, wave IV's trajectory has morphed into a sideways movement, resembling a triangle pattern. This wave IV commenced at 2147, with the triangle formation centering around the significant 2000 level. Should the immediate descent from 2147 align with the presumed triangle scenario, the 2000 level is poised to act as a pivotal support, potentially propelling a bullish breakout towards the 2100-2200 range.

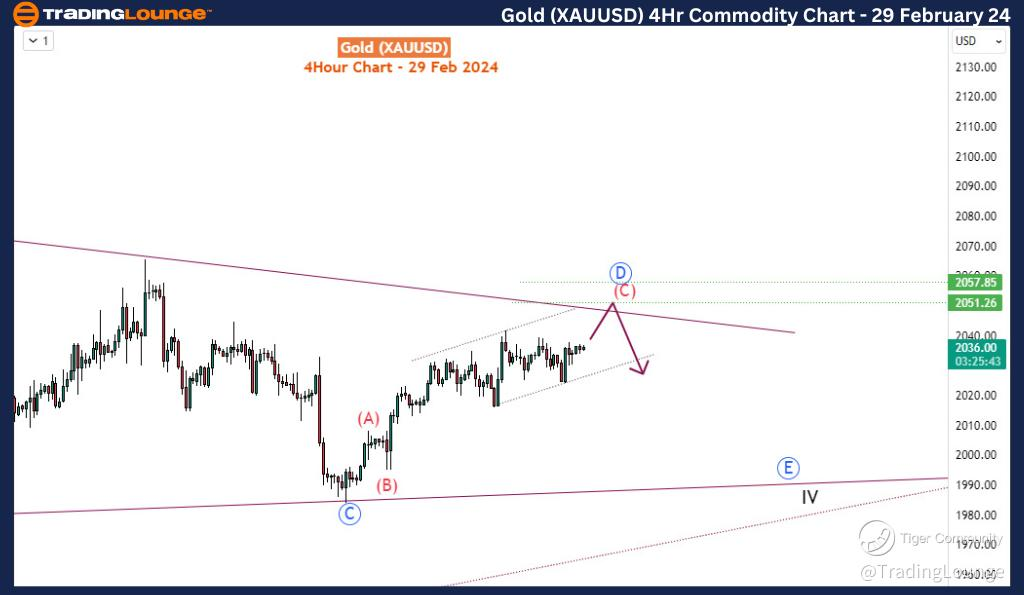
Conversely, a breach below 2000 and the lower boundary of the triangle would signify a different interpretation, suggesting the immediate decline from III as the initial leg of wave IV, thus paving the way for further downward movements. Simplifying the analysis, the preference leans towards the former scenario. Delving into the H4 chart, detailed labeling of the sub-waves comprising wave IV sheds further light on the unfolding pattern.

Observing the H4 chart, blue wave D nears its culmination, likely targeting the 2051-2057 supply zone or slightly below. A potential final upswing may transpire before a subsequent breakdown occurs. Should such a breakdown materialize, wave E could emerge, setting its sights on revisiting the critical 2000 level once more, completing the anticipated wave IV correction cycle.

Gold Elliott Wave daily chart

Gold

Gold Elliott Wave four hour chart

Chart

Gold Elliott Wave analysis [Video]

As with any investment opportunity there is a risk of making losses on investments that Trading Lounge expresses opinions on.

Historical results are no guarantee of future returns. Some investments are inherently riskier than others. At worst, you could lose your entire investment. TradingLounge™ uses a range of technical analysis tools, software and basic fundamental analysis as well as economic forecasts aimed at minimizing the potential for loss.

The advice we provide through our TradingLounge™ websites and our TradingLounge™ Membership has been prepared without considering your objectives, financial situation or needs. Reliance on such advice, information or data is at your own risk. The decision to trade and the method of trading is for you alone to decide. This information is of a general nature only, so you should, before acting upon any of the information or advice provided by us, consider the appropriateness of the advice considering your own objectives, financial situation or needs. Therefore, you should consult your financial advisor or accountant to determine whether trading in securities and derivatives products is appropriate for you considering your financial circumstances.

Recommended Content


Recommended Content

Editors’ Picks

AUD/USD holds lower ground below 0.6350 after dismal Australian data

AUD/USD holds lower ground below 0.6350 after dismal Australian data

AUD/USD keeps its offered tone intact below 0.6350 in Wednesday's Asian trading, undermined by below forecasts Australian Constuction Output and monthly CPI data. The data fan more RBA rate cut expectations. Risk-off flows and renewed US Dollar demand also add to the weight on the Aussie. 

AUD/USD News
USD/JPY: Rebound gathers steam to near 149.50

USD/JPY: Rebound gathers steam to near 149.50

USD/JPY is extending the rebound to near 149.50 in Asian trading on Wednesday. The pair tracks the upswing in the US Dollar and the US Treasury bond yields, fuelled by the US House passage of the Republican Budget plan, advancing Trump's tax plans. 

USD/JPY News
Gold buyers jump back amid tariff uncertainty

Gold buyers jump back amid tariff uncertainty

Gold price struggles to build on Tuesday’s rebound in the Asian session on Wednesday. Gold buyers try their luck as safe-haven flows return on US President Donald Trump’s tariff uncertainty and weak US economic prospects.

Gold News
Strategy stock dips as Bitcoin price crashes below $90K, sparking concerns of forced liquidation

Strategy stock dips as Bitcoin price crashes below $90K, sparking concerns of forced liquidation

Strategy witnessed an 11% stock decline on Tuesday, stirred by Bitcoin's market's plunge below $90,000 and fueling speculations of a forced liquidation for the company.

Read more
Five fundamentals for the week: Fallout from German vote, Fed's favorite figure stand out

Five fundamentals for the week: Fallout from German vote, Fed's favorite figure stand out Premium

Statements, not facts, are set to dominate the last week of February. Further fallout from Germany's elections and new comments from Trump on trade may overshadow most figures –but not the Fed's favorite inflation figure.

Read more
The Best brokers to trade EUR/USD

The Best brokers to trade EUR/USD

SPONSORED Discover the top brokers for trading EUR/USD in 2025. Our list features brokers with competitive spreads, fast execution, and powerful platforms. Whether you're a beginner or an expert, find the right partner to navigate the dynamic Forex market.

Read More

Majors

Cryptocurrencies

Signatures

Best Brokers of 2025