Gold ($XAU/USD) buying the dips after Elliott Wave zig zag

In this technical blog we’re going to take a quick look at the Elliott Wave charts of GOLD, published in members area of the website. As our members know, we’ve been favoring the long side in the commodity. Recently GOLD ( $XAUUSD ) made a pull back that has had a form of Elliott Wave Zig Zag pattern. We expected GOLD to find buyers at the extreme zone from the 03/08 peak. In the further text we are going to explain the Elliott Wave Pattern and trading strategy.
Before we take a look at the real market example, let’s explain Elliott Wave Zigzag.
Elliott Wave Zigzag is the most popular corrective pattern in Elliott Wave theory . It’s made of 3 swings which have 5-3-5 inner structure. Inner swings are labeled as A,B,C where A =5 waves, B=3 waves and C=5 waves. That means A and C can be either impulsive waves or diagonals. (Leading Diagonal in case of wave A or Ending in case of wave C) . Waves A and C must meet all conditions of being 5 wave structure, such as: having RSI divergency between wave subdivisions, ideal Fibonacci extensions and ideal retracements.
At the chart below we can see what Elliott Wave Zig Zag pattern looks like in real market.
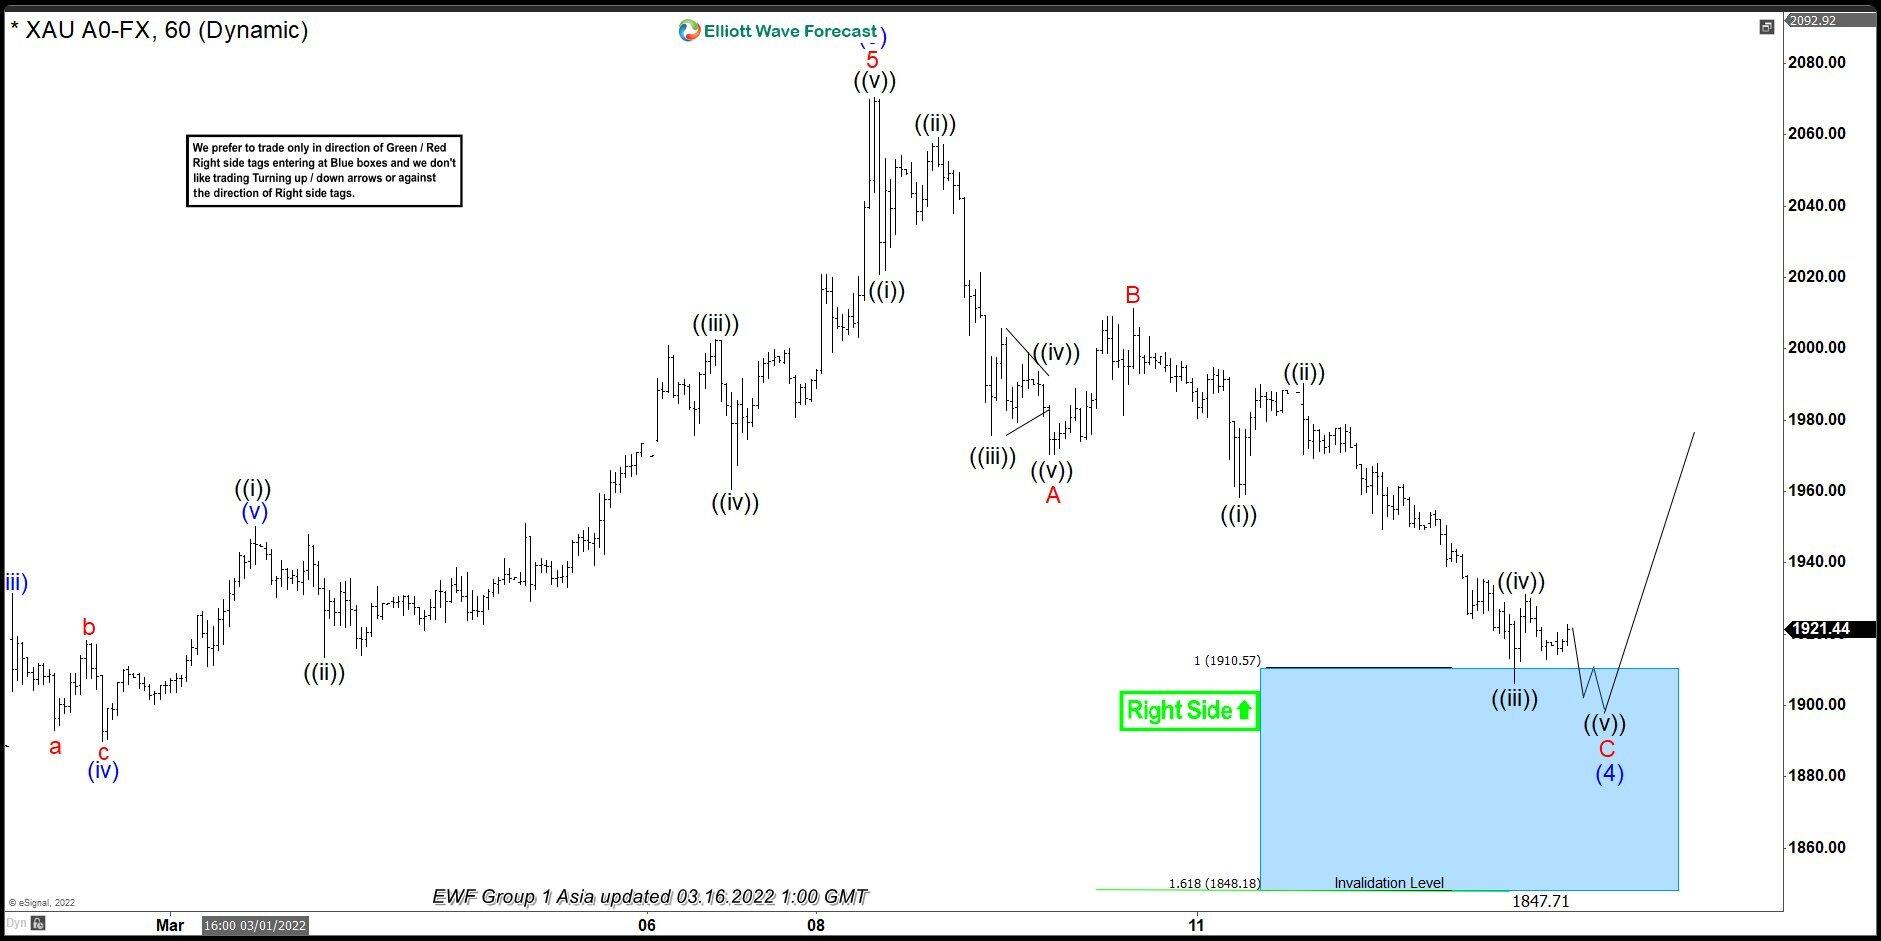
Gold H1 Elliott Wave analysis 03.16.2022
GOLD is correcting the cycle from the 1779.3 low. Recovery has reached the extremes from the peak at 1910.57, however pull back doesn’t look completed yet. We assume pull back is unfolding as Elliott Wave Zig Zag Pattern. That means both A and C leg has to have a form of 5 waves structure. We can count clear 5 waves down in A red leg. On other hand C red still missing another low to have clear 5 waves form. Consequently we are calling for another marginal push lower within blue box. Anyway, we don’t recommend selling. We favor the long side from the marked blue box zone :1910.5-1848.1. As the main trend is bullish we expect buyers to appear at the blue box for 3 waves bounce at least. Once bounce reaches 50 Fibs against the B red high, we will make long position risk free ( put SL at BE) and take partial profits. Invalidation for the trade would be break below 1.618 fibs extension: 1848.1
As our members know Blue Boxes are no enemy areas , giving us 85% chance to get a pull back.
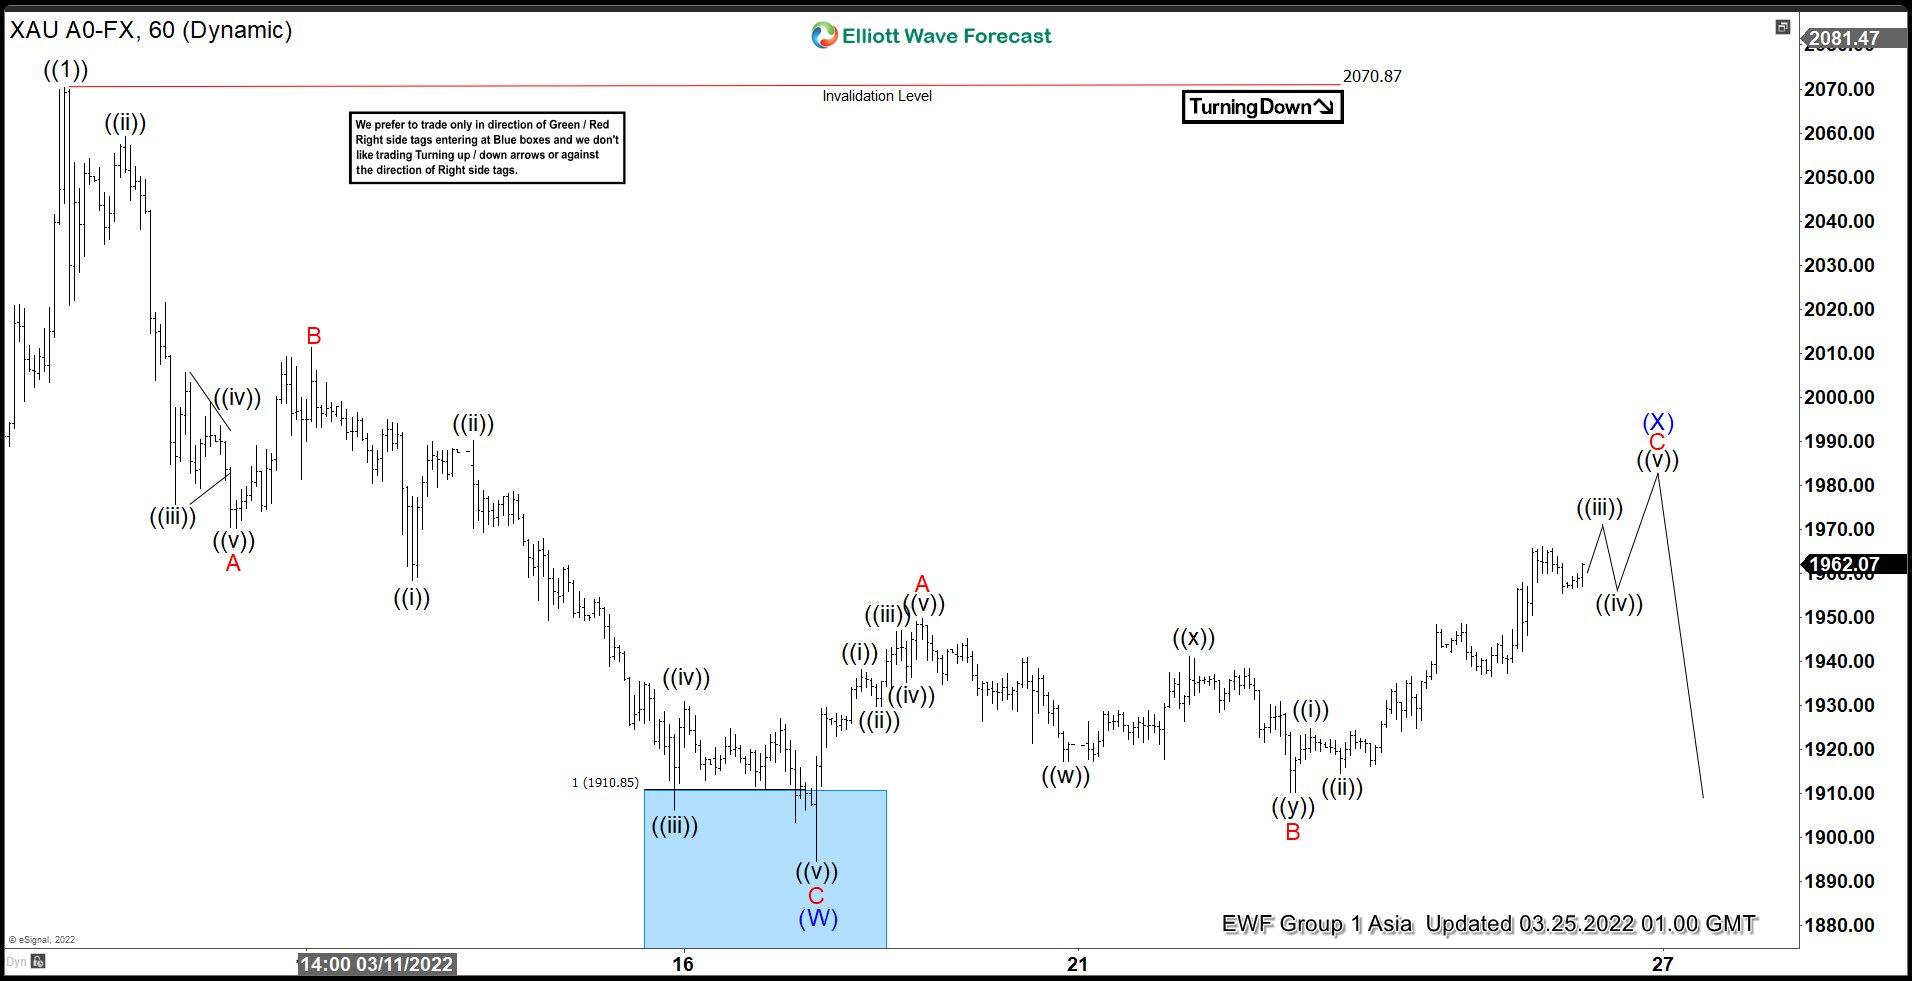
Gold H1 Elliott Wave analysis 03.25.2022
The commodity made another wave down within blue box area, complete clear 5 waves in C red leg and found buyers as we expected. We got nice reaction from the blue box, which reached and exceeded 50 fibs against the B connector, so any long trades from the blue box should be risk free at this stage+ partial profit taken. Current view suggests we still can get another leg down within cycle from the peak. (X) blue recovery can complete at 1965.69-1999.65 area. However, don’t recommend selling the commodity against the main bullish trend. Alternatively if 2070.87 pivot gives up, it will denied current view and we will call pull back completed. Right side is the long side and GOLD remains buy in the dips.
Author

Elliott Wave Forecast Team
ElliottWave-Forecast.com


