GOLD (XAU/USD). Bullish Primary C. Powerful Impulses. Long-Term

GOLD (XAU/USD) – Medium-Long Term Analysis:
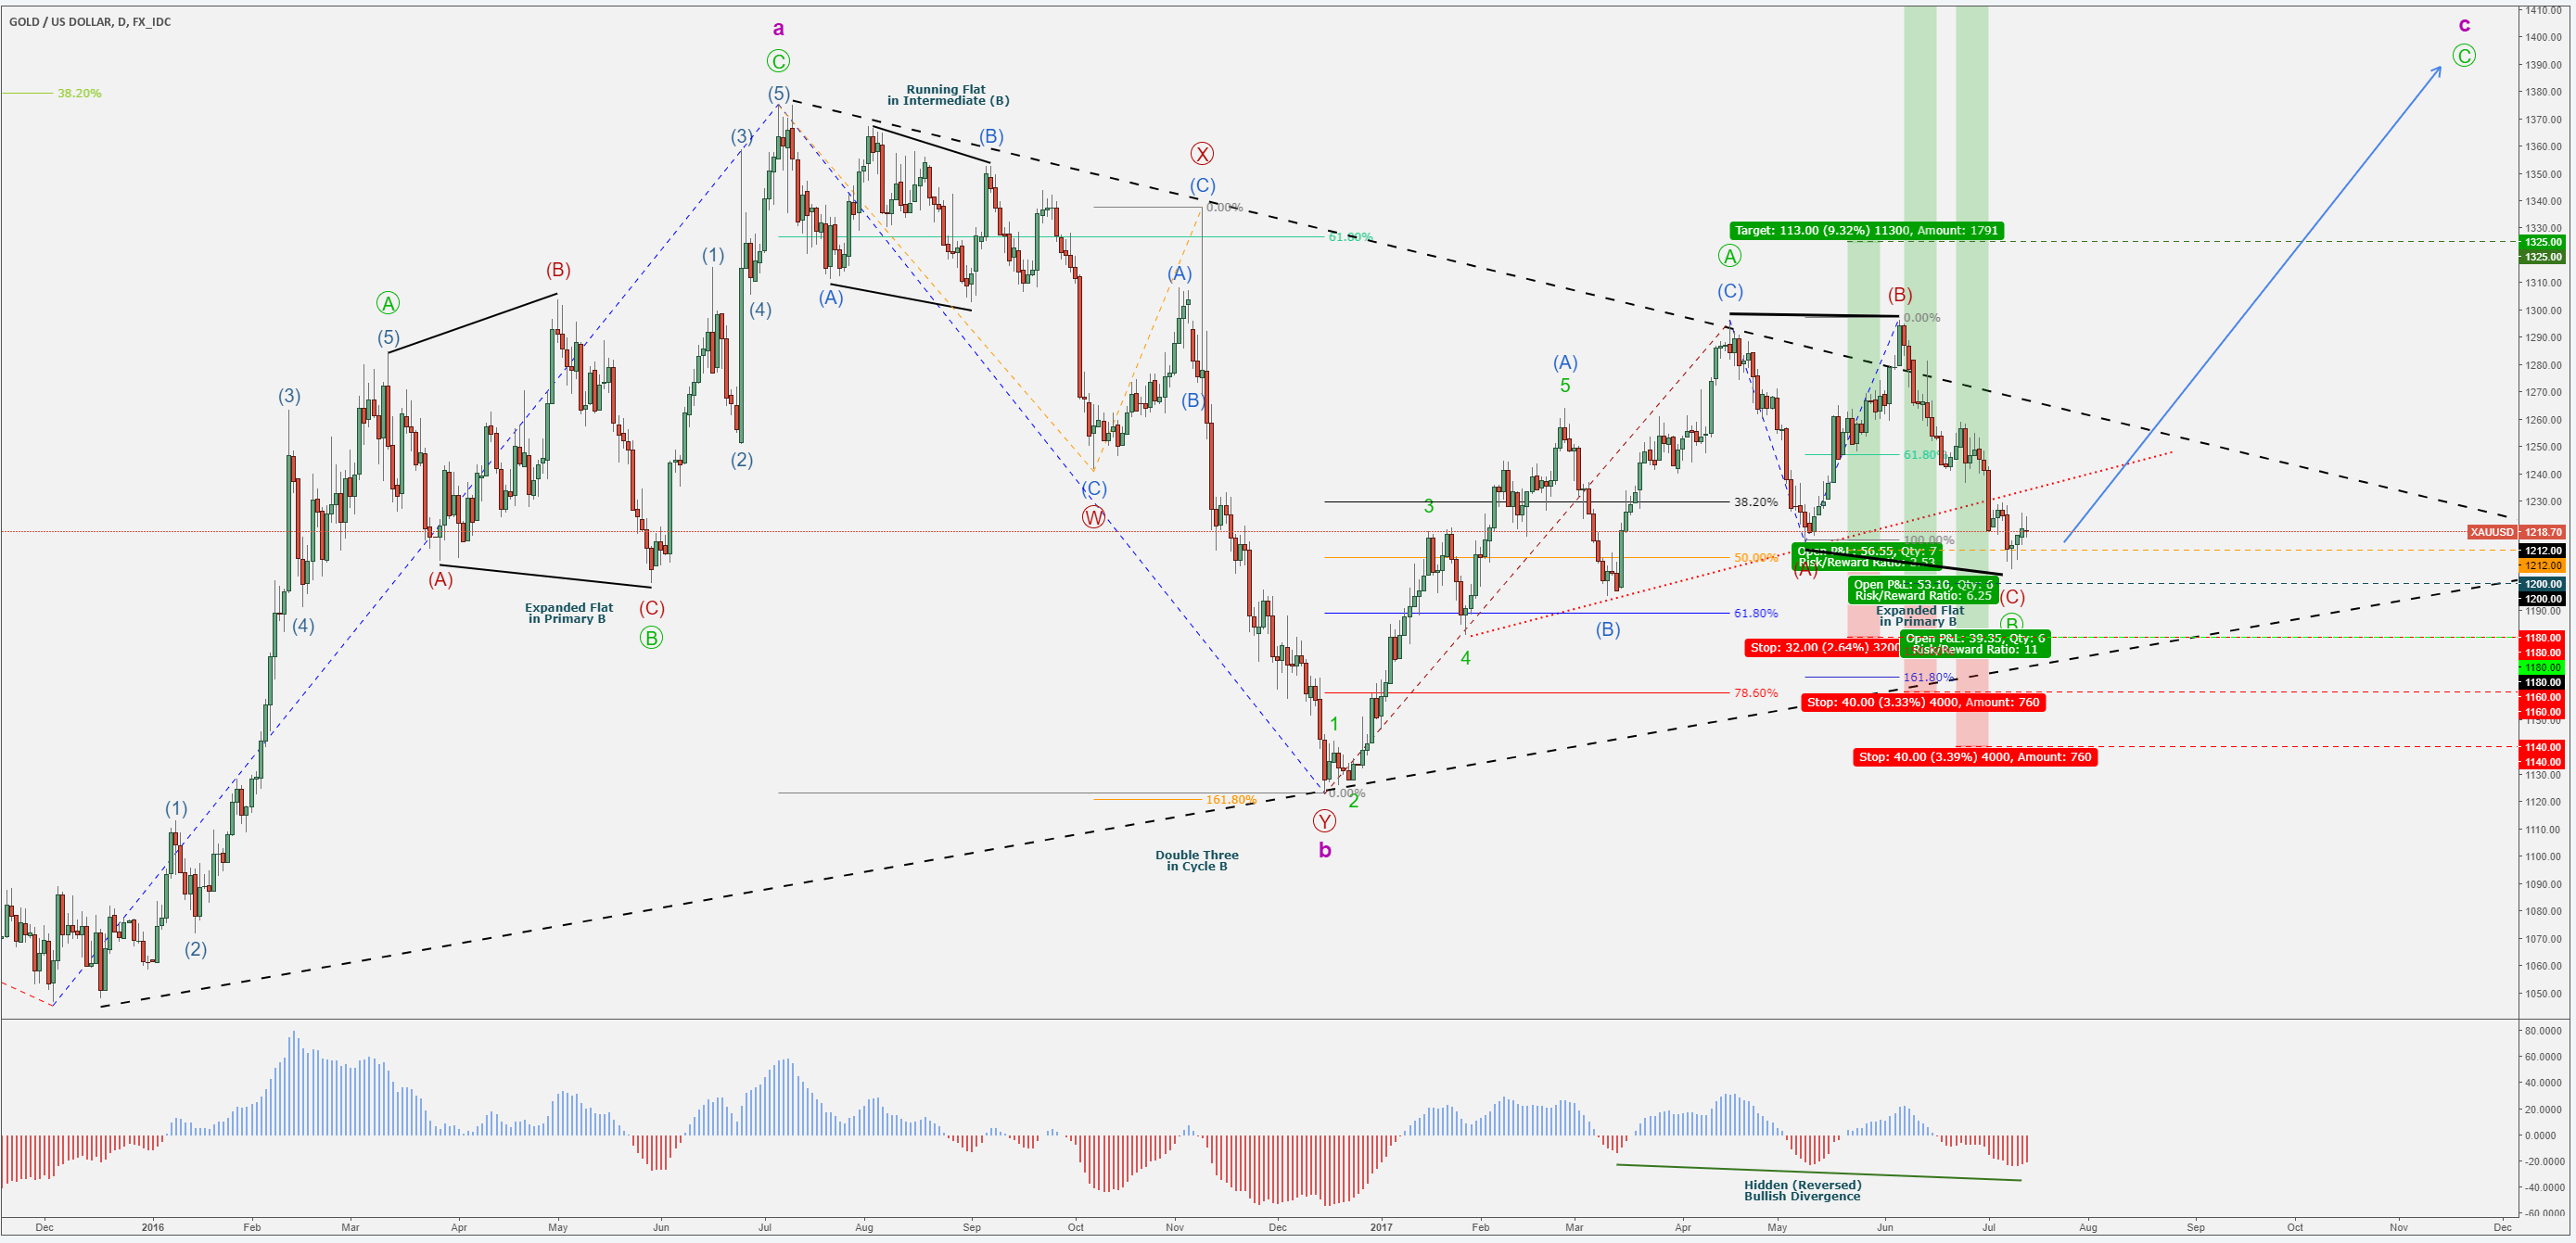
GOLD (XAU/USD) started a Cycle ABC Up-Trend in Dec 2015 with Cycle Wave A (pink), which lasted until Jul 2016.
Corrective Cycle B (pink) unfolded with a Complex WXY (red) Double Three Structure and lasted until Dec 2016.
Cycle Wave C (pink) started unfolding in Dec 2016 and according to the Time-Line Cycles in Elliott Wave Analysis, it would take it the same time as Cycle Wave A (pink) to complete.
GOLD (XAU/USD) - Daily Chart:
Primary A (green) - Wave Analysis:
Within Cycle Wave C (pink), Primary A (green) unfolded with 5 Waves Sequences in its Intermediate Waves (A) & (C) and a 3 Wave Sequence in Corrective Intermediate (B), which would confirm that Primary C (green) would most likely unfold with a 5 Waves Sequence as well in its Intermediate Bullish Structure.
It took 4.5 Months for Primary A (green) to unfold and complete which would signify that Primary C (green) would most likely unfold within the same Time Frame.
Fundamental Analysis – Bullish Speculation:
Fundamentally speaking, Geo-Political events, Post Brexit factors or UK uncertainty, Tensions at Countries borders or World-Wide Banking concerns, Debts or Economic Instability would trigger Primary C (green).
Technical Analysis – Bullish Speculation:
Technically, Correlations with the Mining Sectors could confirm this view, due to GDX about to possibly finalize its Corrective Zig-Zag Structure and resume an Up-Trend.
Primary B (green) - Wave Analysis:
GOLD (XAU/USD) unfolded the Corrective Structure in Primary (B) (green) with an Expanded Flat due to the fact that Intermediate (B) (red) surpassed the start of Intermediate (A) (red).
The Running Flat scenario has been removed from the equation due to the fact that the Significant Support on the Red Trend-Line from Minor 4 (green) towards Intermediate (A) (red) at 1220.00 Levels was Breached.
There is a possible Confirmation of an Expanded Flat Scenario due to the Hidden (Reversed) Bullish Divergence popping on the Volumes Bars.
The Expanded Flat Scenario is currently in focus, with Price Action sitting and waiting for a decision around the 1200.00 Levels, the 50% Fibonacci Retracements of Primary A (green).
These Levels also represent the 100% Fibonacci Extensions of Intermediates (A) & (B) (red), towards the possible end of Intermediate (C), the end of Primary B (green) and the long-awaited start of the Aggressive Bullish Rally in the potential Primary C (green).
GOLD (XAU/USD) is indeed trading within the Range of the Trend-Lines Triangle Pattern (black dotted lines) and the upper Trend-Line is acting as a Strong Resistance, as confirmed by the Rejection of Intermediate (B) (red).
Eventually, according to this Analysis, Primary C (green) would need to Breach the upper Trend-Line and then gain Support on it in order to unfold its Cycle.
Lower Triangle Trend-Line would be treated with seriousness in case of Price Action reaching it, although Technical Analysis would not agree entirely with such scenario.
GOLD (XAU/USD) – Medium-Long-Term – Bullish Views:
Levels in Focus:
Aggressive – 1120.00
Invalidation – 1180.00
Moderate – 1200.00
Invalidation – 1160.00
Conservative – 1180.00
Invalidation – 1140.00
Target1 – 1325.00
Target2 – 1450.00
Target3 – 1620.00
* Safety Measures:
– When in the green, moving SL to break-even or in profit.
– If Bearish Continuation bellow 1200.00 and If Conservative, one would wait for Bullish Divergence and Lower Triangle Trend-Line Support.
Many Pips Ahead!
RT
Author

Richard Tataru
XGlobal Markets
Richard is a market analyst and holds the role of Senior Account Manager at XGLOBAL Markets. He is passionate about technical analysis and has been exploring the charts for years.


