Gold Weekly Forecast: The price is close to an important resistance level leading into next week
- Gold is 2.5% higher on the week but the September candle closed 4.63% in the red.
- The price tested an interesting level his week which was close to the previous all-time high.

Technical picture (weekly chart)
The weekly chart below shows the black resistance line at the old September 2011 high of USD 1920.94 per troy ounce. It is interesting that this area has come back to haunt the bulls but a break and close above on the daily chart could be significant. It would then be the start of the confirmation that the retracement is over.
This week the price came very close to testing the resistance area and stopped just short at USD 1917.10. Although the shadows (wicks) of the previous few weeks candles come slightly lower down.
In terms of trend patterns, the price did break the previous wave low and a lower high lower low was created on the daily chart. The next target on the downside could be the red support level which was very important back in 2011. This level was the consolidation high after price retraced from the aforementioned all-time high (USD 1920.92, in 2011).
-637372498887074207.png)
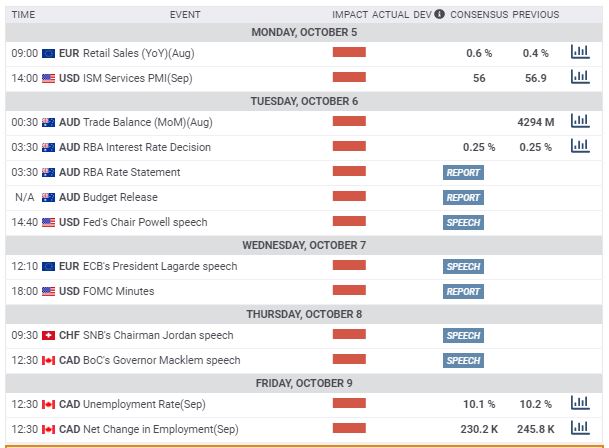
Fundamentals and next week's calendar
The big event this week was supposed to be the non-farm payroll reading. This was overshadowed by the news that US President Trump and his wife contracted the coronavirus. They are said to be in good spirits and it has been said that now his democratic opposition leader Joe Biden is being tested too. Both leaders are in a high-risk category due to their age but seem to be doing well at the moment.
Friday's non-farm payroll result came in at 661K lower than the 850K consensus estimates. This was well within the estimated range but the unemployment rate fell to 7.9% vs 8.4% which was welcome news for the US administration.
Next week's calendar is much lighter. The key data highlight is the FOMC meeting minutes on Wednesday. This could give us more insight into the thinking of the US central bank. The market is due to hear from Fed chair Powell the day before so there could be some news or updates that make the meeting minutes obsolete.
On Monday the market will get te us ISM services PMI. This is expected to come in lower than the previous reading but if there is a surprise to the upside gold might well take a dive off the back of some dollar strength. As the reading is for September it will be up to date and there have not been too many restrictions but the west coast wildfires could have had an impact.
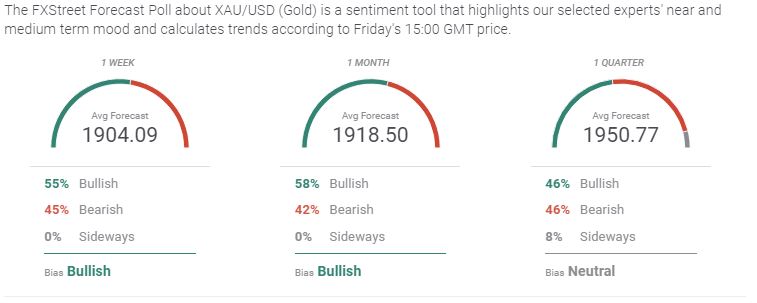
Trader Sentiment
The traders who have been polled have turned more bearish over the week. Gold is currently trading at USD 1900 per troy once but the traders average long term forecasts have been revised lower. Having said that all three of the estimates are higher than where the price is at the moment so that might please the bulls.
Links to other gold-related articles
Gold Weekly Forecast: XAU/USD melts into next week with lower levels in sight
Gold Price Analysis: XAU/USD eyes $1,928 after Trump contracts coroanvirus – Confluence Detector
Premium
You have reached your limit of 3 free articles for this month.
Start your subscription and get access to all our original articles.
Author

Rajan Dhall, MSTA
FX Daily
Rajan Dhall is an experienced market analyst, who has been trading professionally since 2007 managing various funds producing exceptional returns.


