Gold, The chart of the Week: How much can the bulls milk in the short squeeze?
- Gold price bulls could be encouraged by Friday's failed breakout scenario, short squeeze in play.
- Bulls eye short-term liquidity towards $1,870 for the initial balance's range high on Monday.
- All eyes will be on US data this week, Consumer Price Index and Retail Sales.

The Gold price fell on Friday, sliding for a second day as the US Dollar and US Treasury bond yields moved up, fulfilling, in part, the forecasts for the week made on February 5 in last week's pre-open market analysis:
Gold, the Chart of the Week: XAU/USD breakout traders triggered in, bear traps being laid down

(February 5 Gold price daily chart analysis above and update to Friday's Gold price close below)
However, while the Gold price fell, it did not close on a spot basis any lower and, in fact, it closed higher for the day. It can also be noted that neither a 38.2% Fibonacci retracement to the upside was accomplished nor the downside target of $1,825.
Interestingly enough is that the trajectory was spot on and this is typical of coiled consolidative market conditions. This can be put down to the phase of market sentiment surrounding the Federal Reserve's monetary policy path owing to conflicting themes such as Fed speakers and fickle-forward guidance compared to outcomes of the economic data.
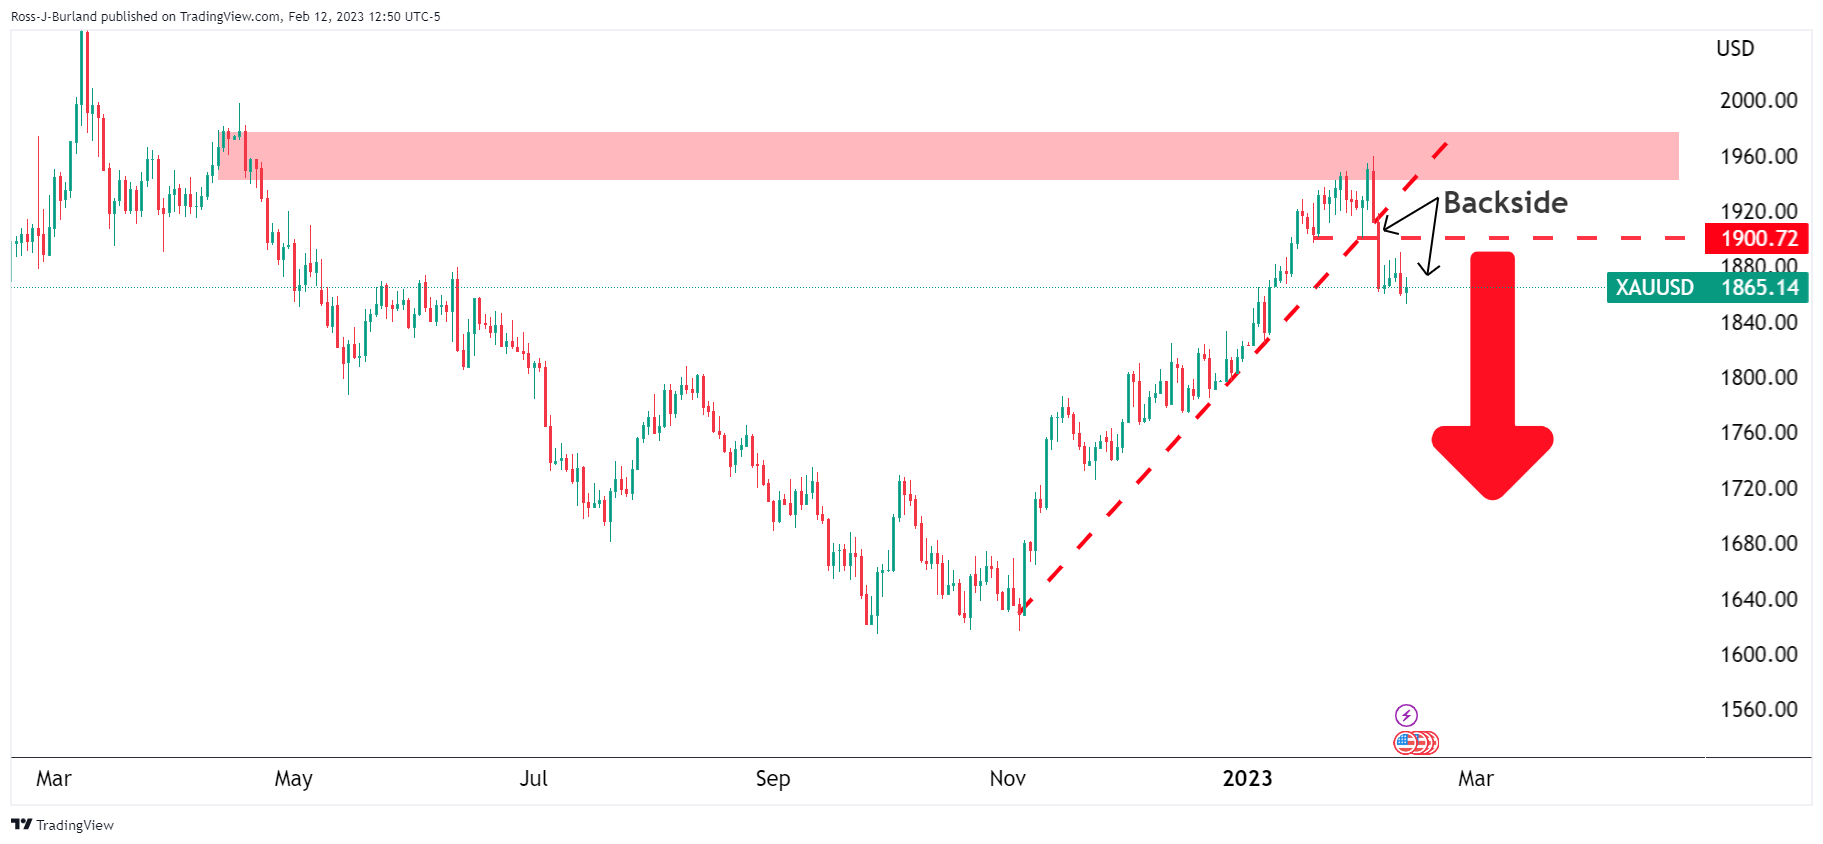
Gold price is on the backside
However, what we do know is that while being on the backside of the daily trend, entrenching the price of the metal below the $1,900 mark it fell below a week earlier, the outlook for the Gold Price from a technical standpoint remains bearish:
Gold price directional bias for the week ahead
Let's take a deeper look at the price action and see if we can't determine a directional bias for the open and sessions/days ahead leading into the US key data events.
Starting from last week's open, we had three days of rise into Wednesday and a great sell-at-the-high of the day after three sessions of rise on Thursday from a 50% mean reversion hourly level:
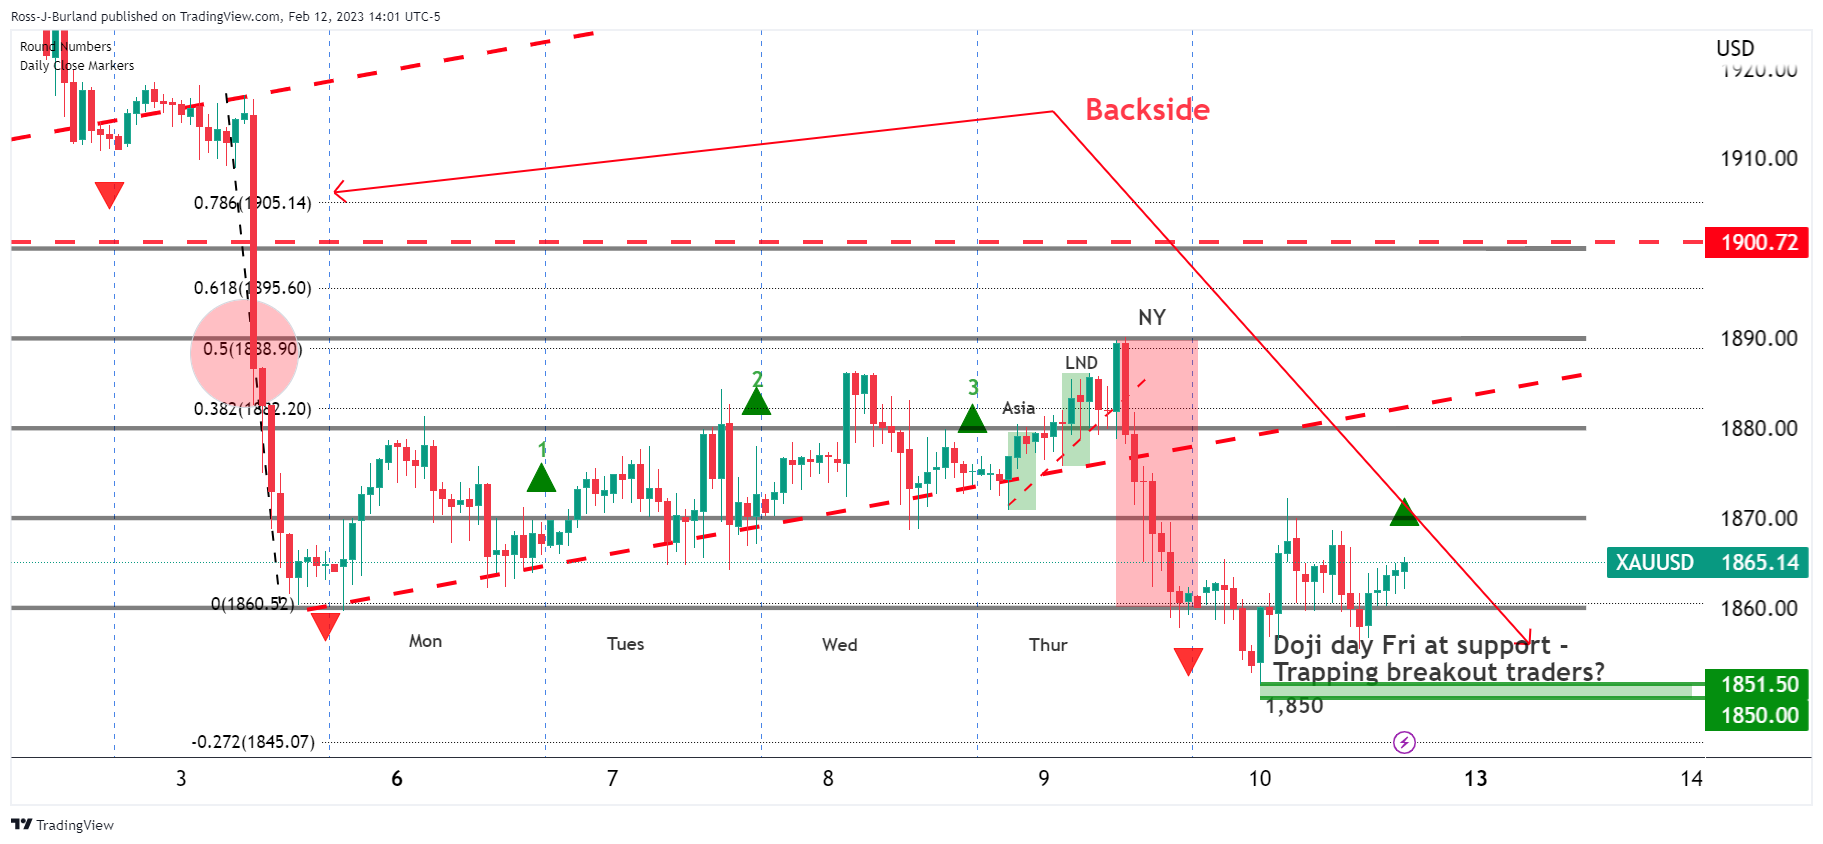
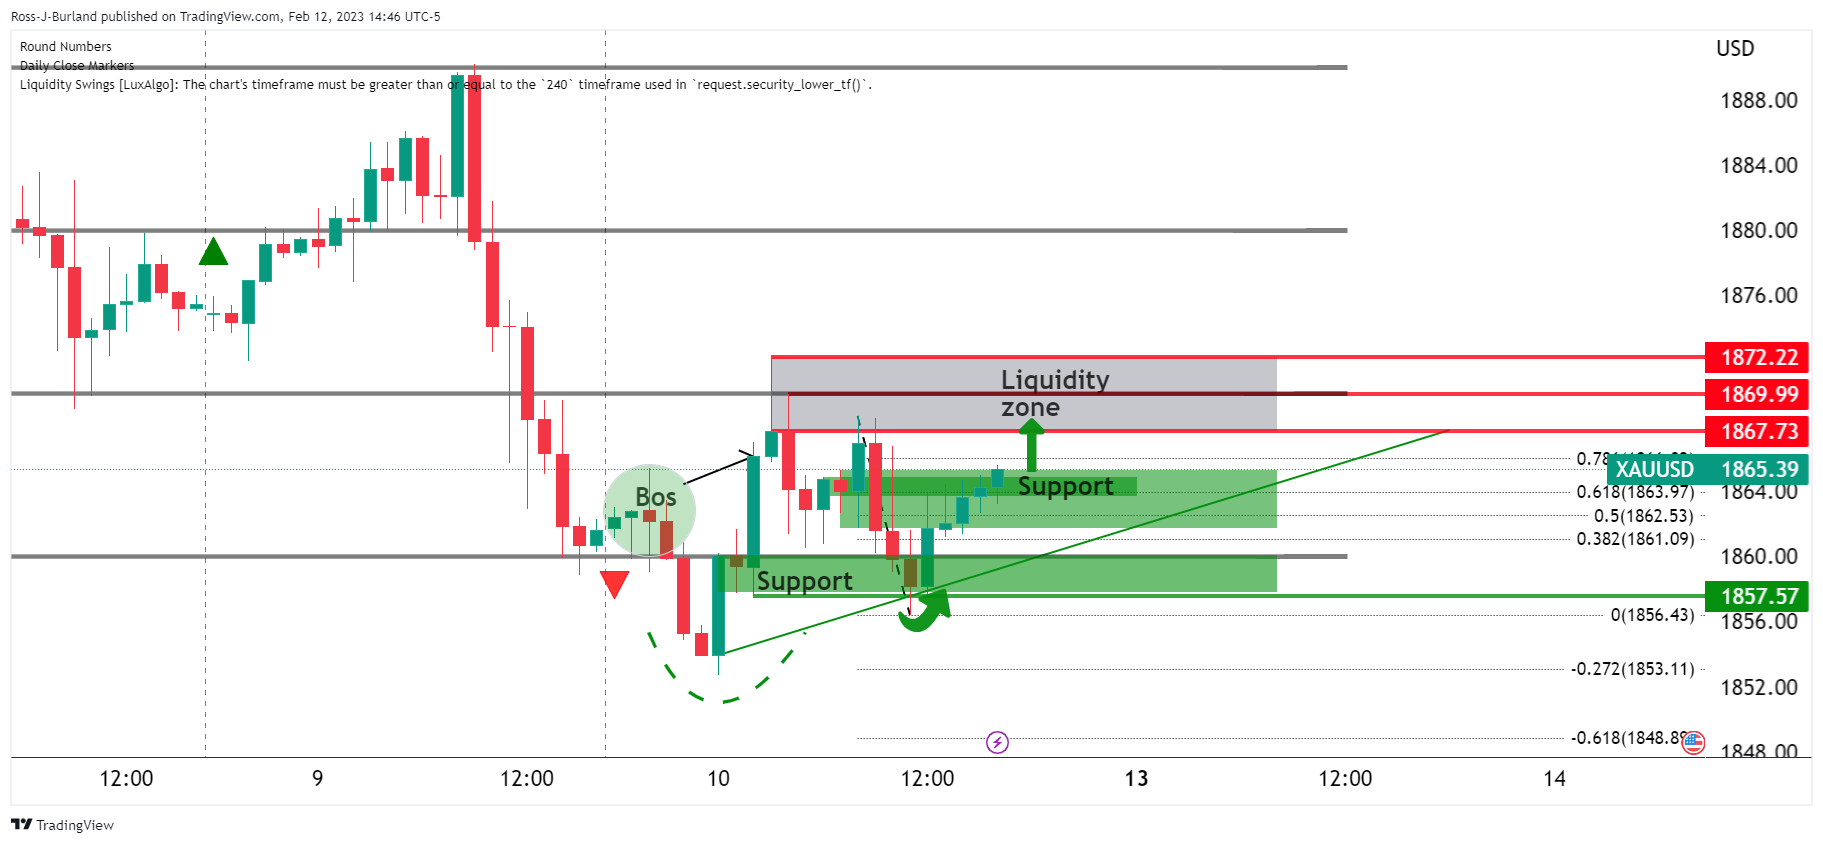
Typically, following a first bearish daily close, a continuation would be expected for a consecutive bearish close but we did not get that so there were bears trying to short the market chasing the various breaks of structures as follows:
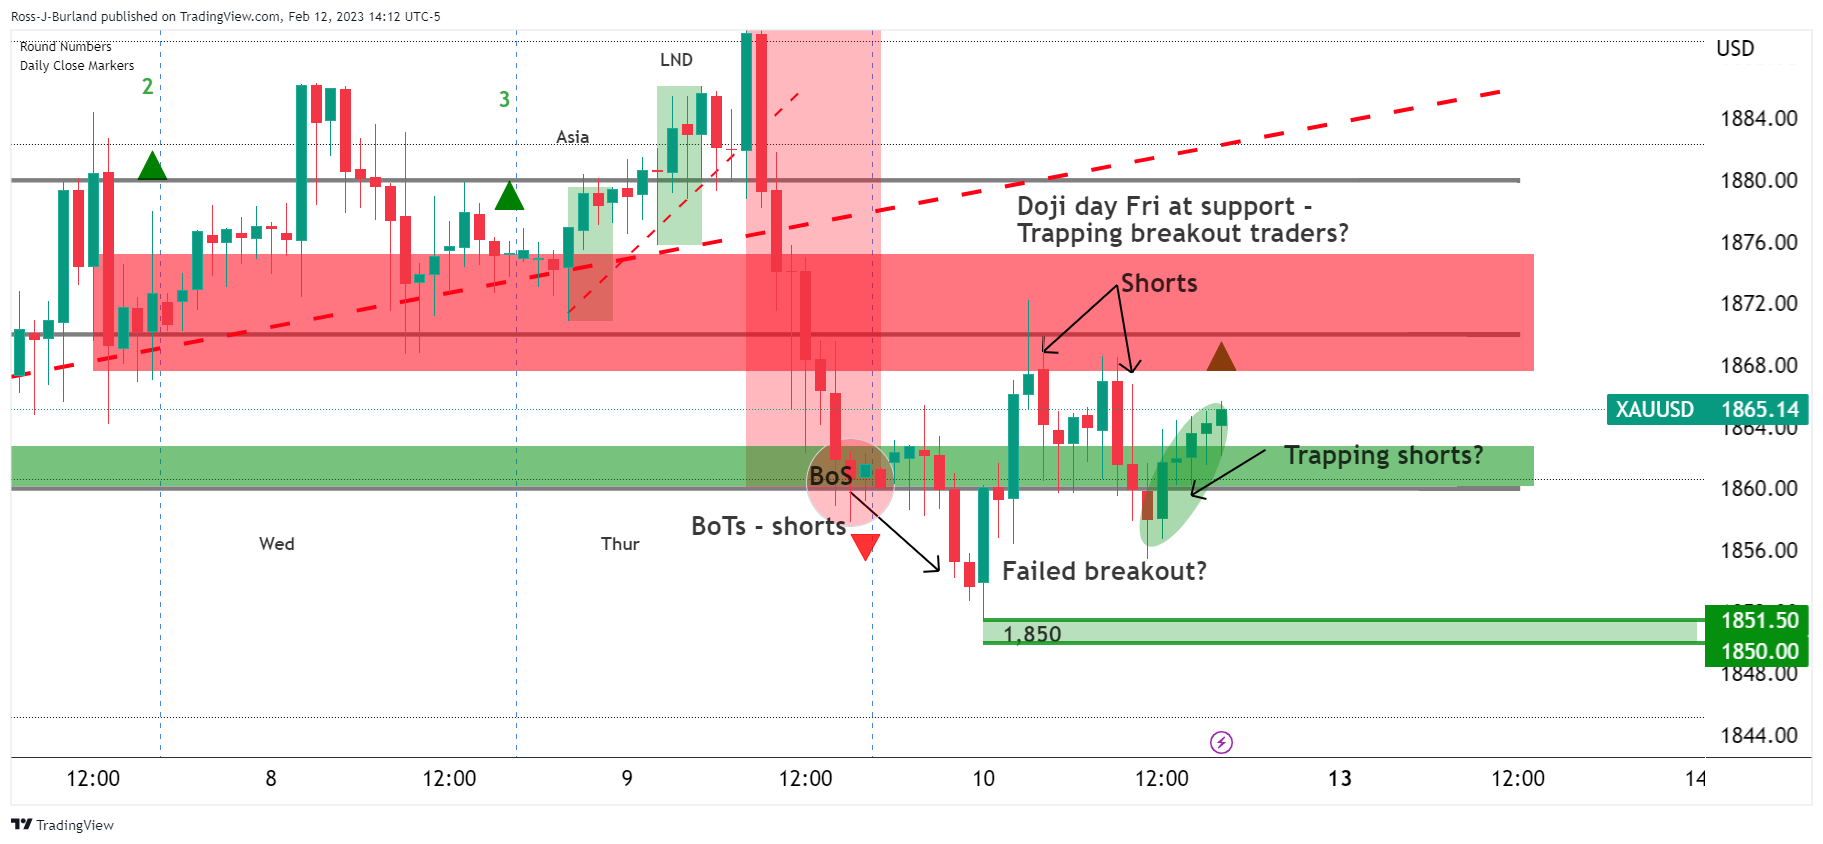
On the chart above, we can see a break of the structure occurred on Friday, BoS, triggering breakout traders getting short, BoTs - shorts, and more shorts selling the highs of the day in both the London and the New York sessions, potentially holding on to their positions and being squeezed.
Additionally, the continuation of the prior bearish hourly impulse had already hit a -272% Fibonacci extension of the correction's range as follows:
The -272% is a key target for continuation trades.
In conclusion, this could be a failed breakout scenario ahead of the CPI data that is scheduled for Tuesday, February 14 and then US Retail Sales the following day.
Most breakouts fail
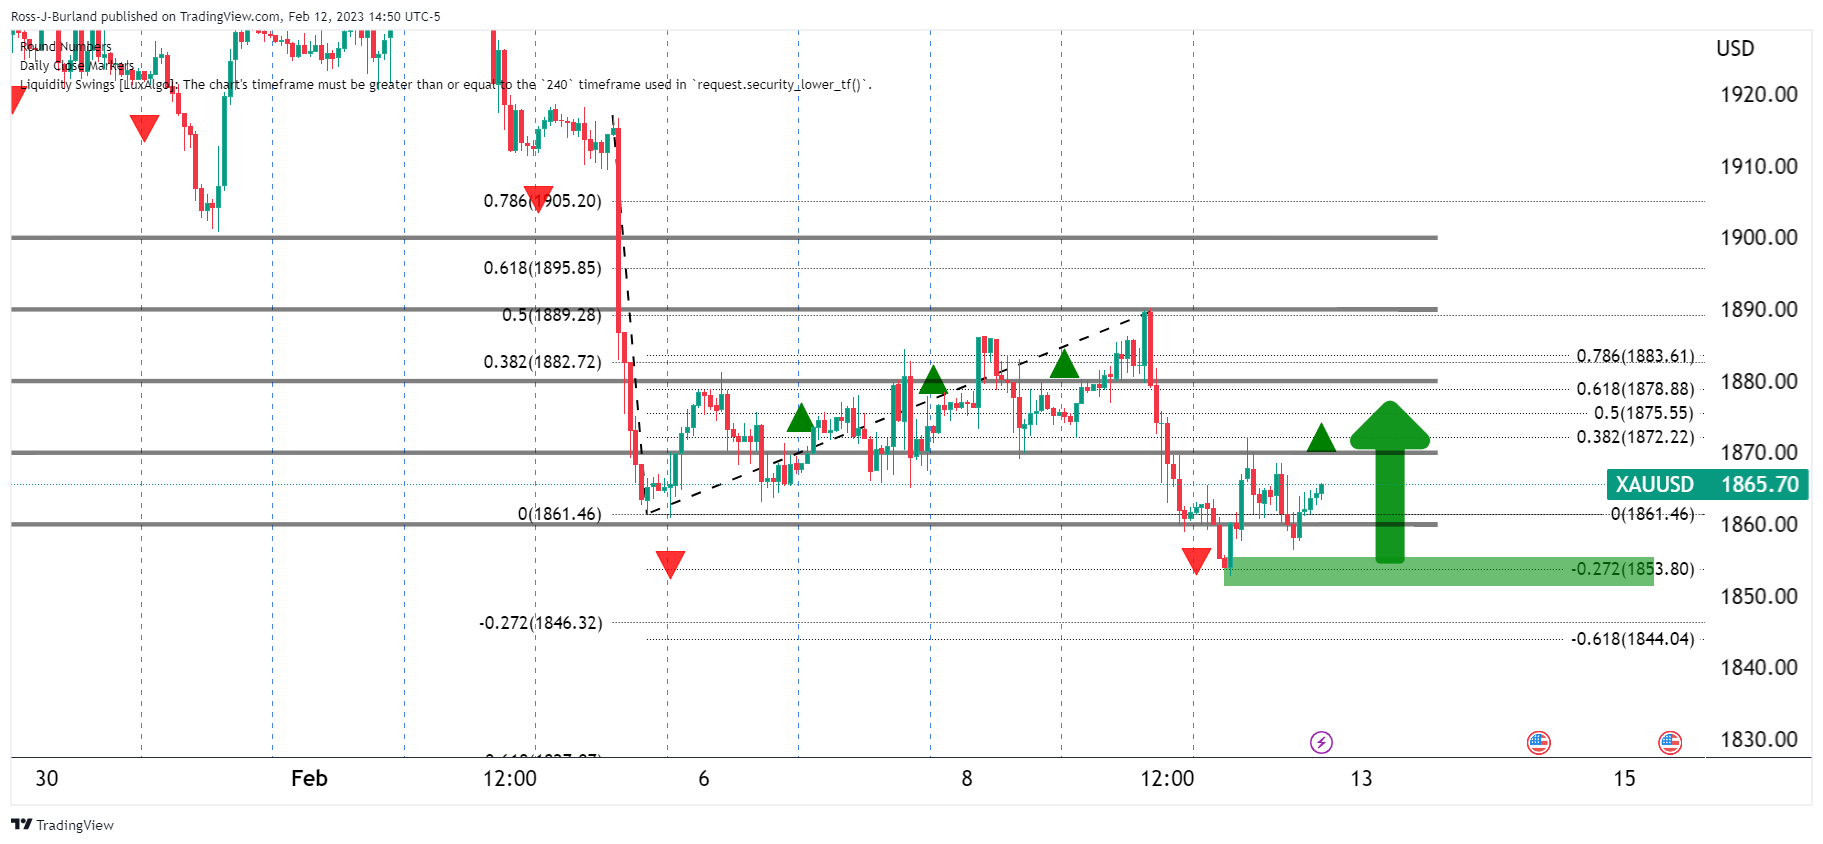
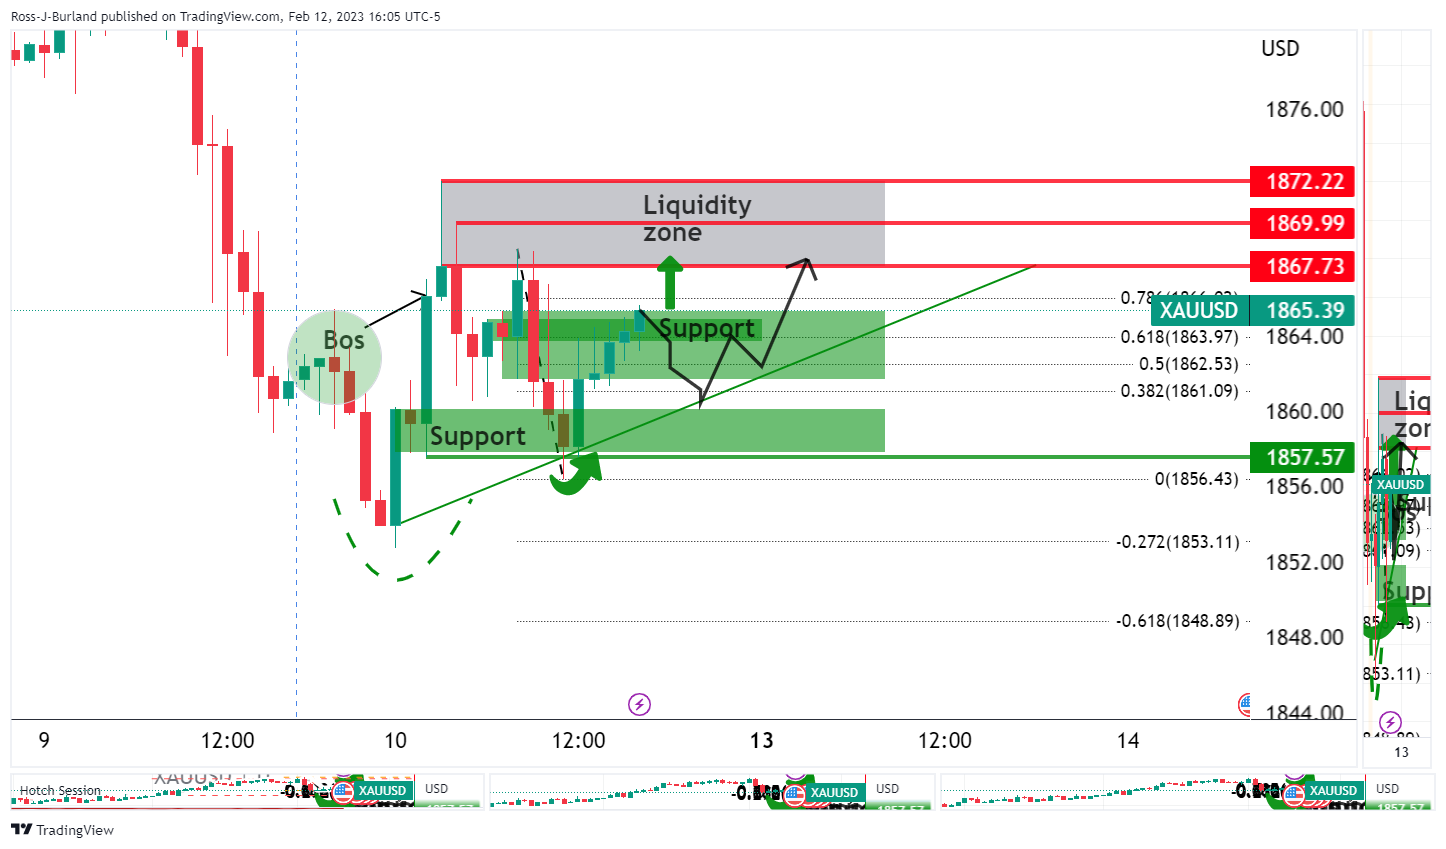
If this is a failed breakout, given that we know most breakouts fail and that we are in a new 100-pip box, for the open, we can draw a thesis that we are setting up for a false break reversal from the lows of last week to target liquidity around $1,870 in a short squeeze:
That's not to say we can't see a move into longs and test the trendline support before the move up on Monday/Tuesday to test stops around 1,860 and the bottom of the new 100 pip box.:
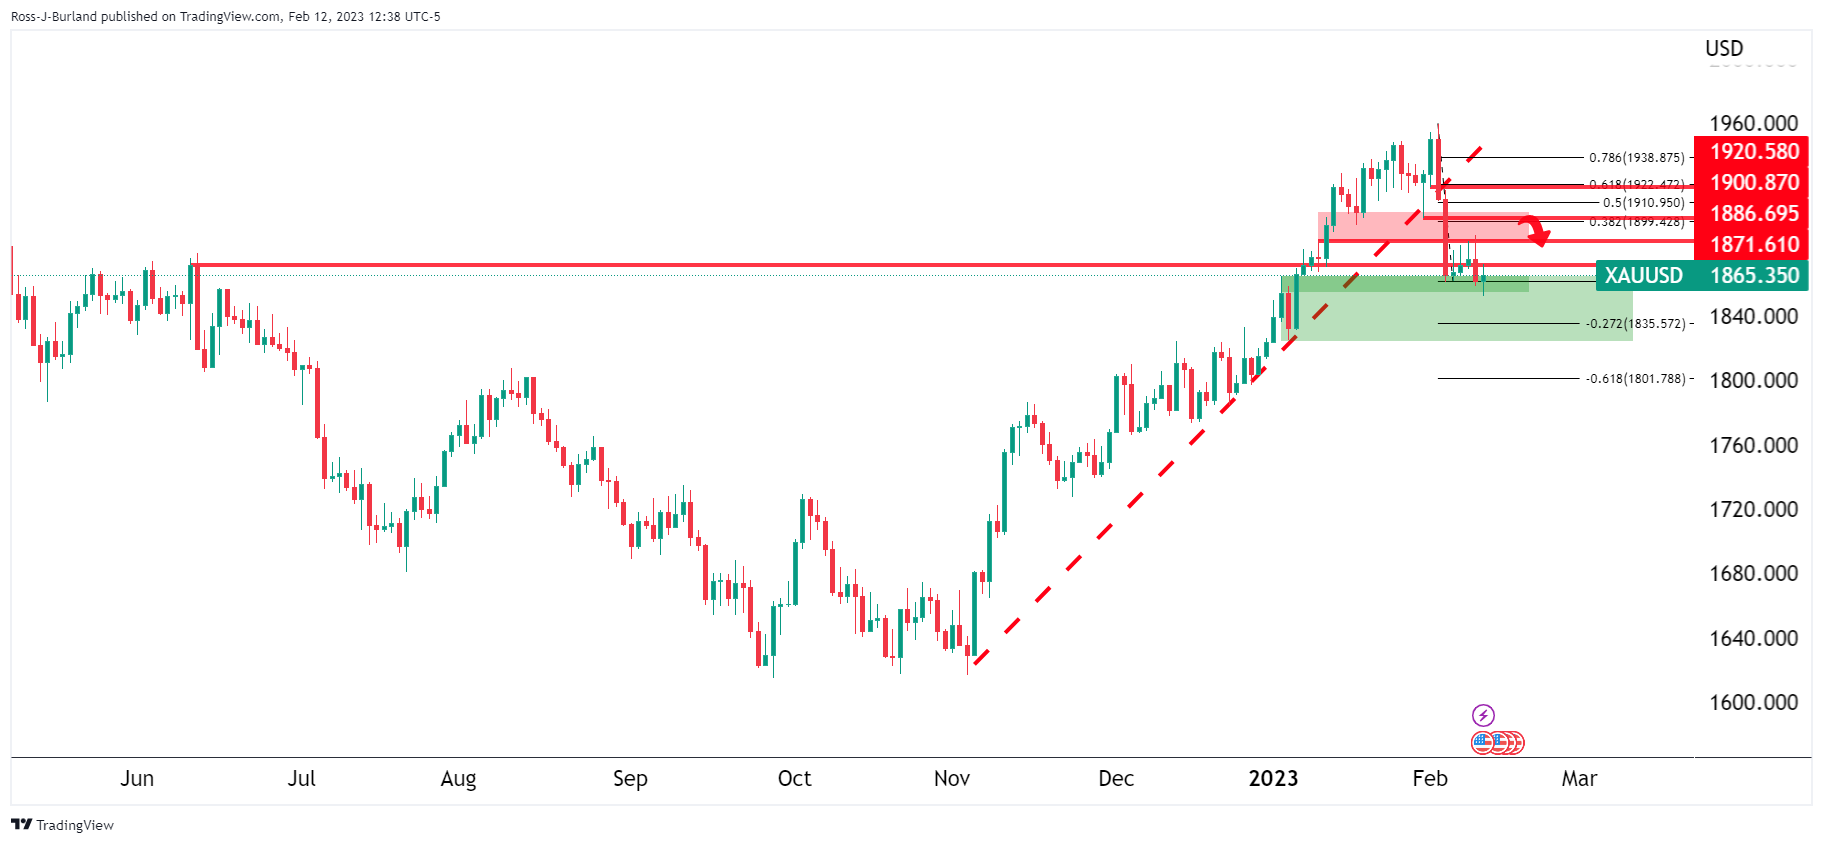
If we zoom out back to the daily charts, we are reminded we still had not reached a 38.2% Fibonacci retracement of the prior daily bearish impulse:
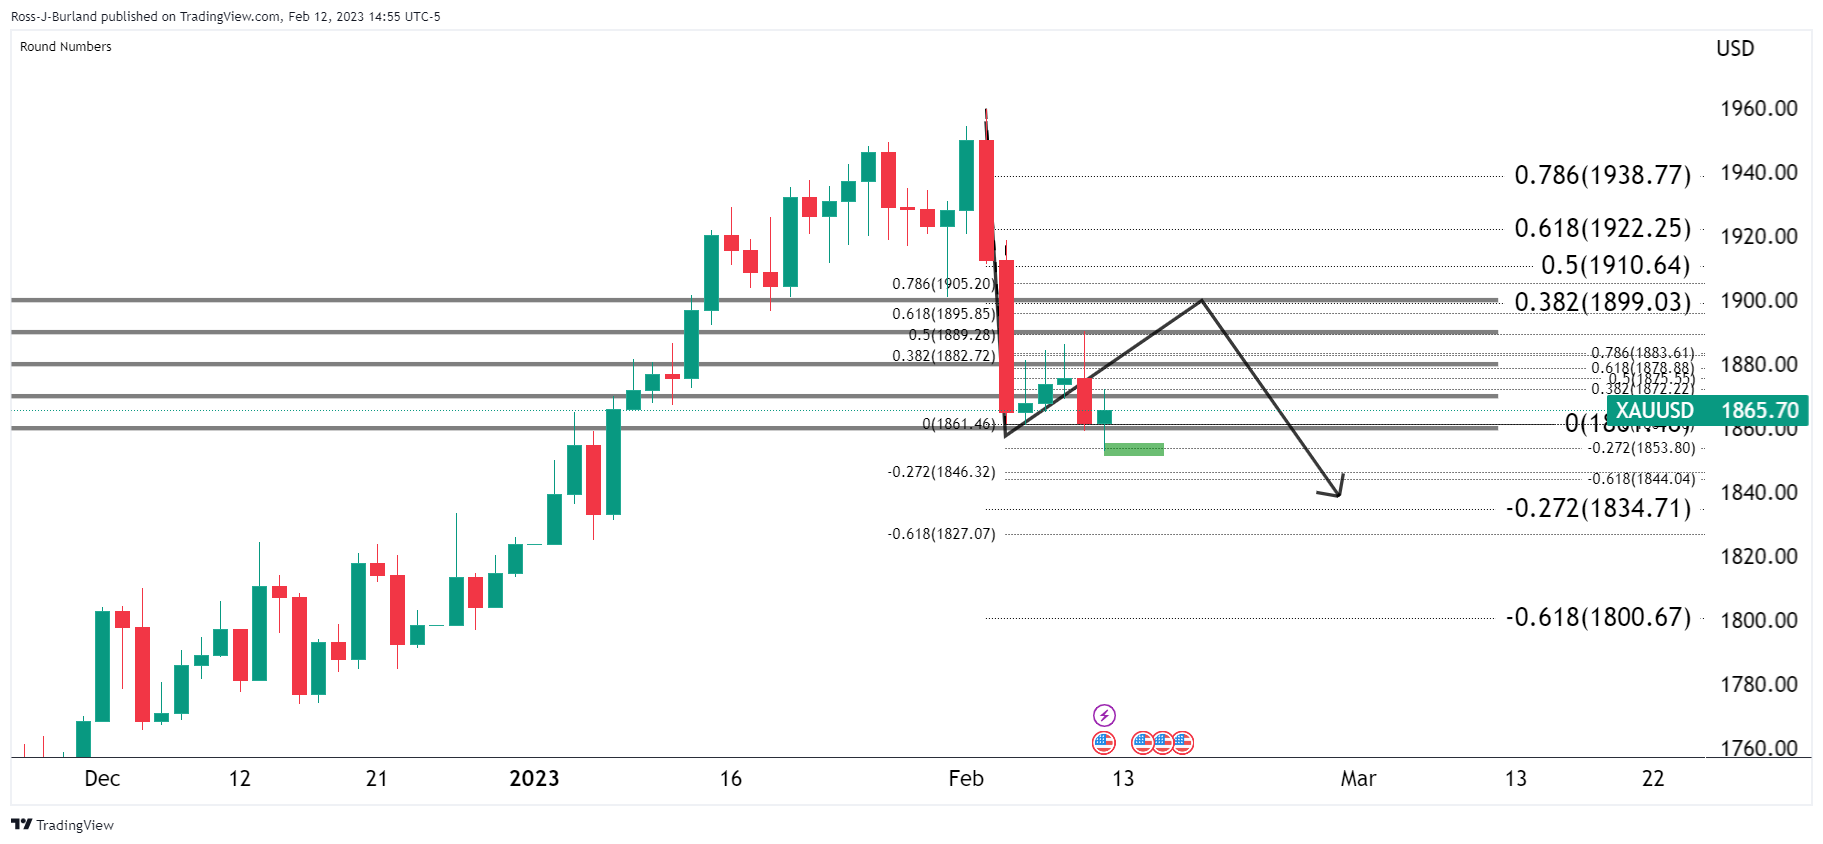
That is to say, we could see some more upside from this week's business. However, we have made a fresh daily low so theoretically, that prior 38.2% is in invalid Fibo if trying to draw it on the prior daily chart's bearish run of consecutive daily closes. Instead, we can jump to the weekly chart and draw the Fibonacci as follows:
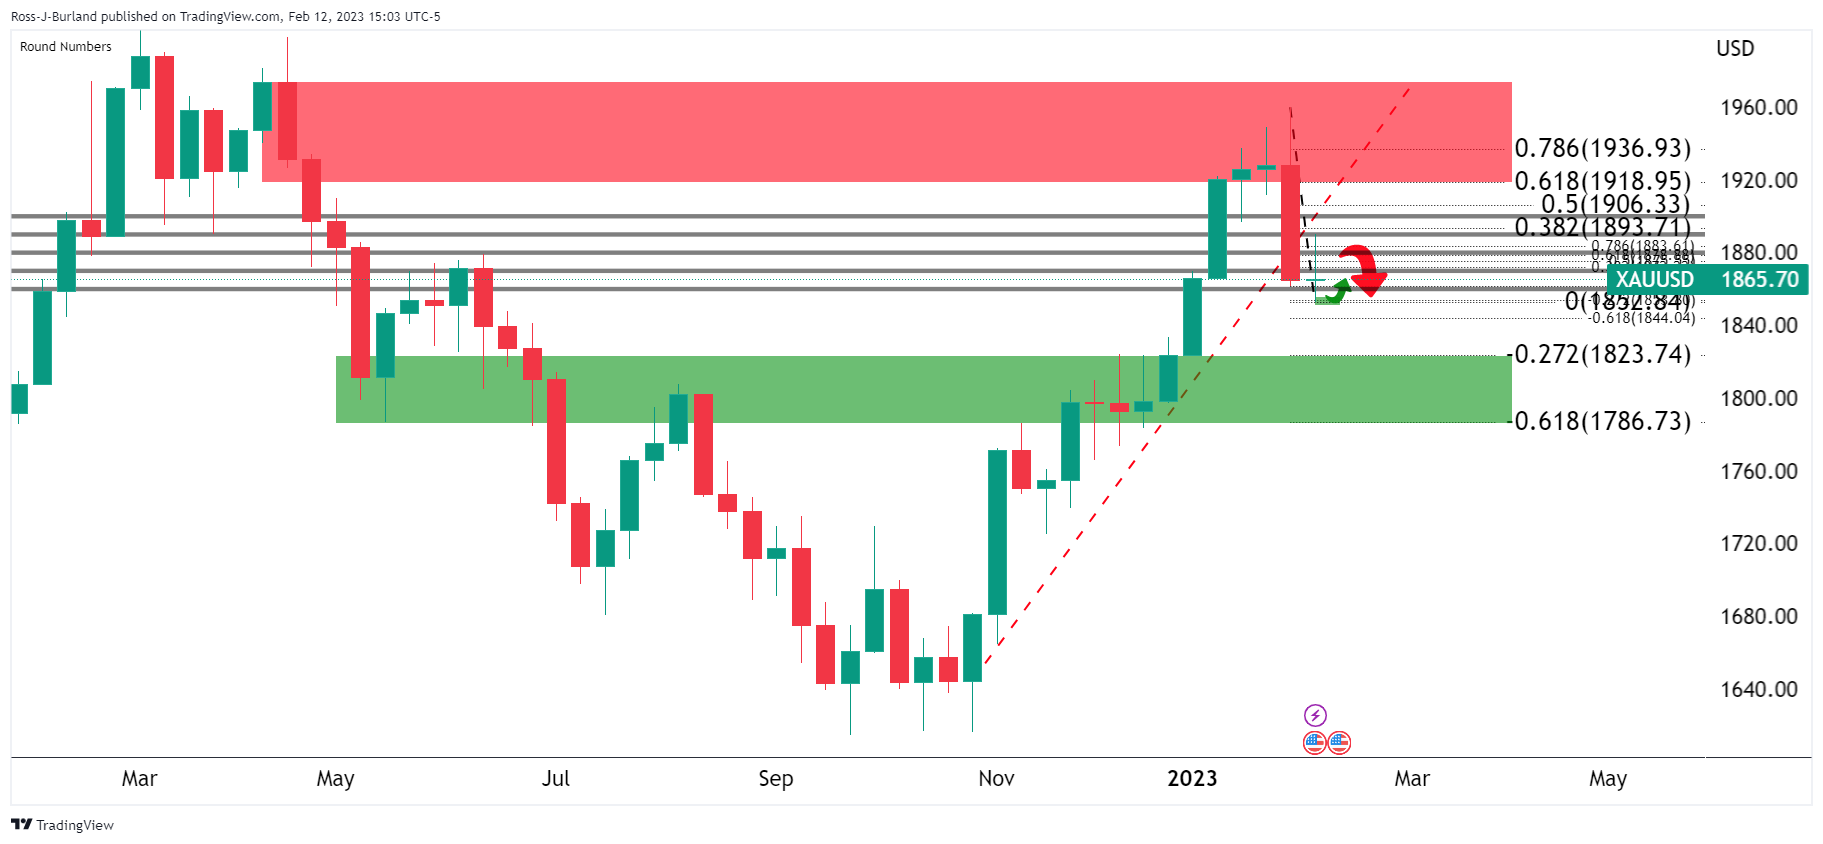
We are still looking at a test of around $1,890 before the next shift to the downside if sticking to the principal bearish thesis drawn back on January 29 when assessing the landscape for the new month of February and initial balance:
Gold, Chart of the Week: XAU/USD trapped bulls into the Fed and NFP
As illustrated below and in the above link, it was stated that we were in the upper third of the 2023 range and on the backside of the first trendline that is broken and acting as a counter-trendline. A break of $ $1,925 was expected to open the risk of a move to test $1,896 and then $1,867 as the top of the lower third of the range that guarded a 1000 pip box low of $1,825:
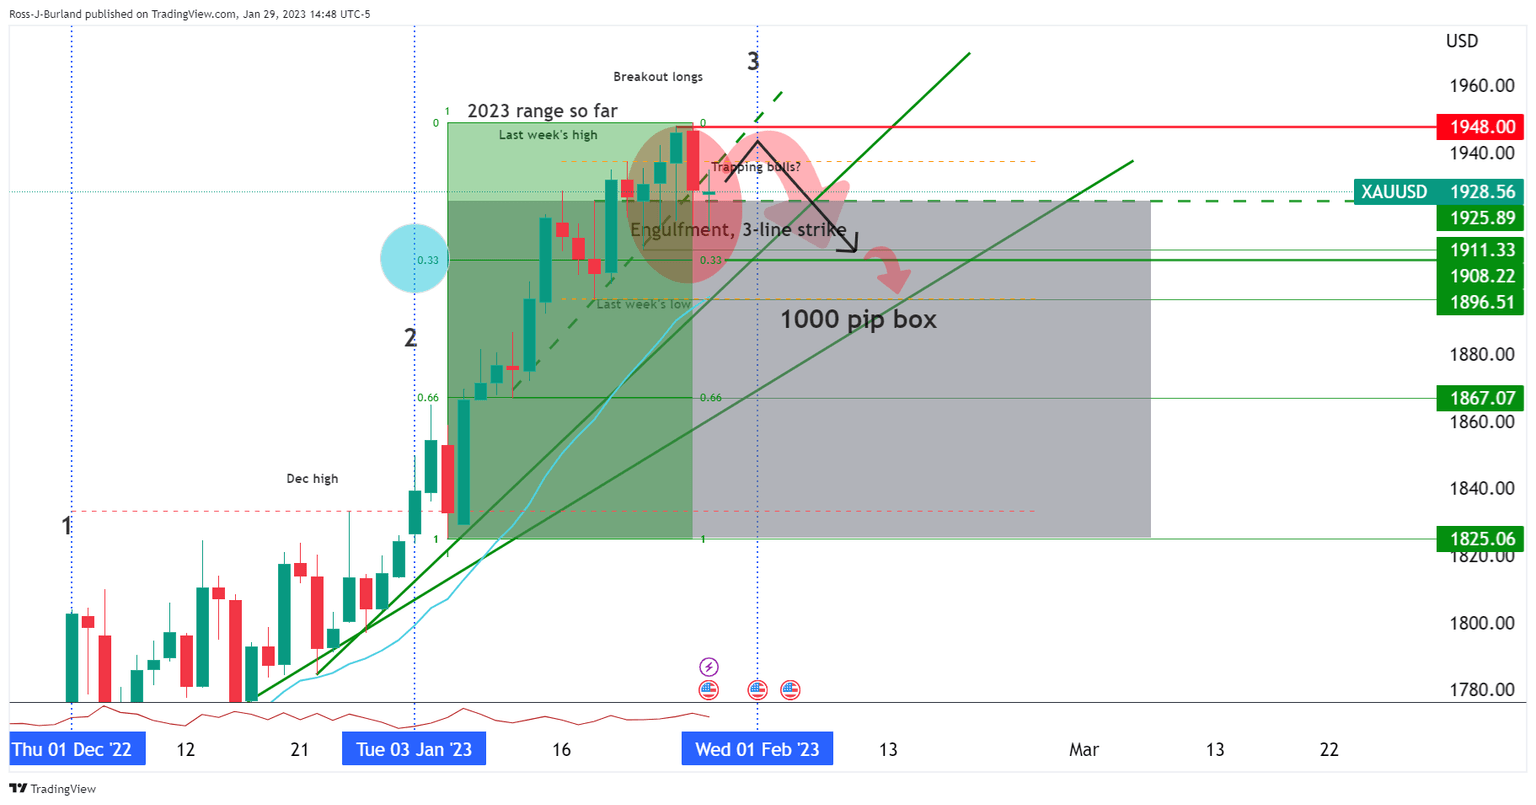
The above chart was analysis drawn at the end of January and below is where we are up to date ahead of the week commencing 12 February open:
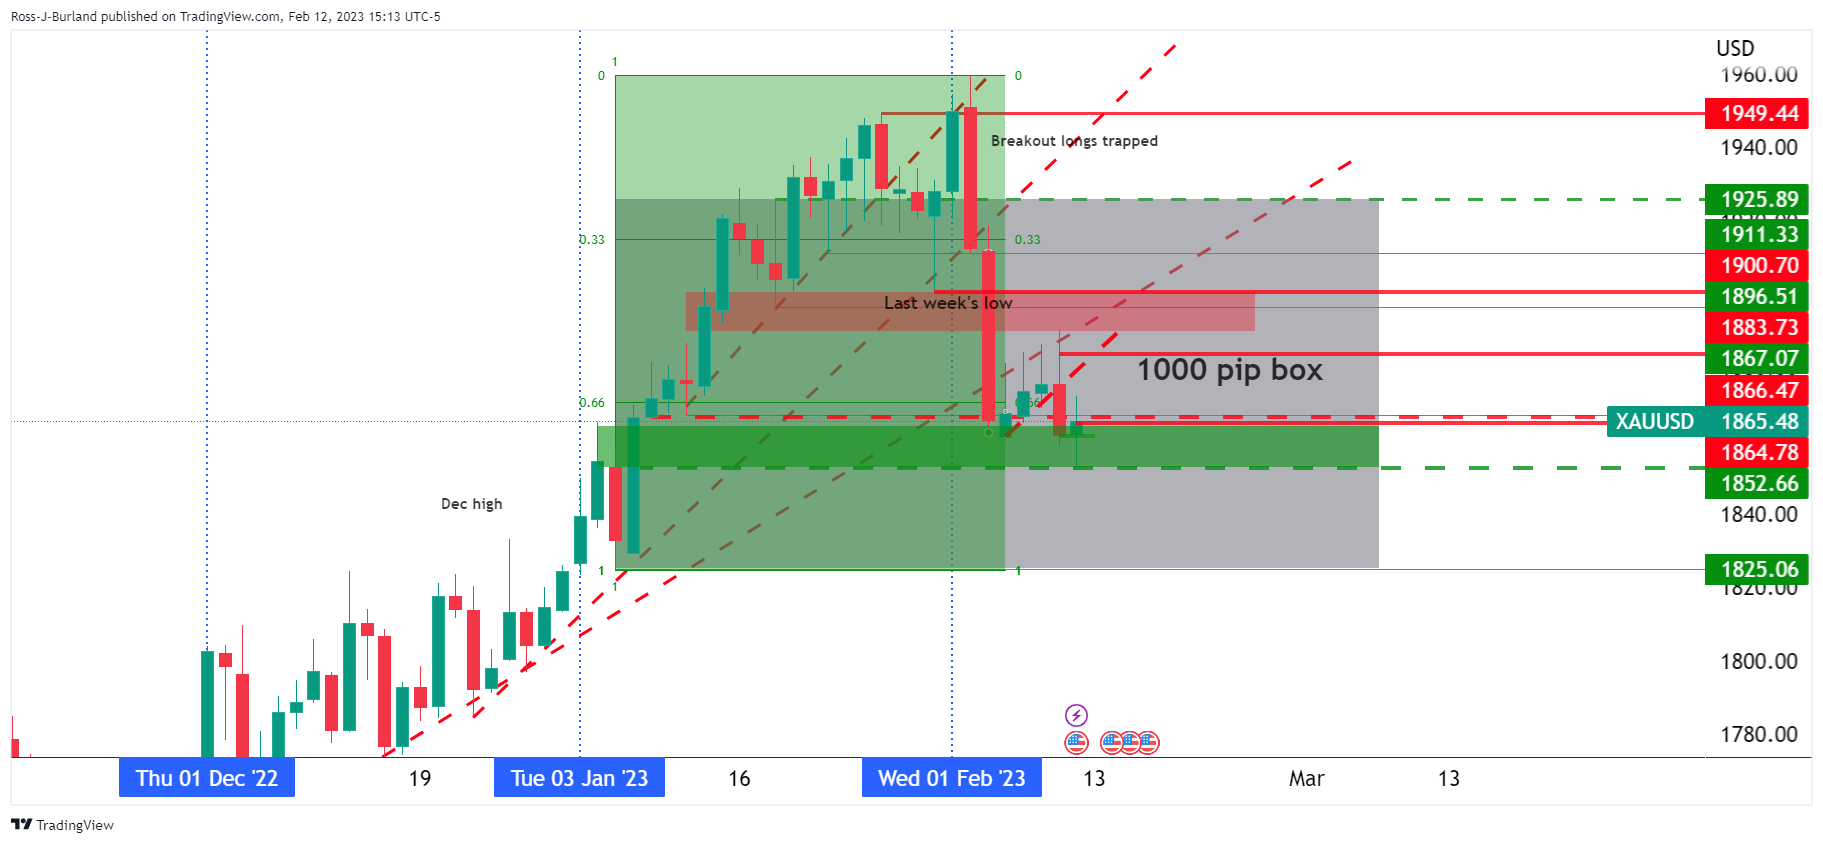
So far, so good.
Gold price week ahead
For the week ahead, the US data could be a pivotal moment and a stronger-than-expected January CPI print would likely reinforce the recent strong economic data theme, pushing market pricing for upcoming rate hikes even higher.
This would be expected to cap any further advancements in the Gold price and potentially be the fuel that the bears need to see the price extend lower within the 1000-pip box.
Eventually, and not necessarily this week as it depends on how much of a squeeze the bulls can put onto the shorts, the bears will need to get below $1,850 support for the low-hanging fruit en route towards the $1,825 target.
Premium
You have reached your limit of 3 free articles for this month.
Start your subscription and get access to all our original articles.
Author

Ross J Burland
FXStreet
Ross J Burland, born in England, UK, is a sportsman at heart. He played Rugby and Judo for his county, Kent and the South East of England Rugby team.


