Gold surges on political gridlock, trade tensions and escalating geopolitical risk
Gold (XAU/USD) has surged to record highs as rising political tensions, economic uncertainty, and dovish policy expectations fuel strong safe-haven demand. The ongoing U.S. government shutdown, renewed trade threats, and escalating conflict in Ukraine are intensifying global market uncertainty. Meanwhile, rising rate cut bets continue to support gold demand. Despite a firmer Dollar, the rally remains intact, supported by a confirmed technical breakout and solid momentum.
Gold climbs on government gridlock, China trade strain, and war tensions
Gold has surged to record highs, gaining strong support from multiple macroeconomic and political factors. The shutdown continues, with no resolution in sight between opposing parties. This ongoing gridlock heightens market uncertainty and strengthens demand for safe-haven assets like gold. As uncertainty deepens, gold continues to act as a preferred hedge against political risk.
Meanwhile, trade tensions have flared again. President Trump threatened to impose 100% tariffs on Chinese imports starting on November 1. The decision came after Beijing imposed stricter controls on rare earth exports. He later softened his stance. However, the threat had already revived fears of supply chain disruptions and a broader economic slowdown. At the same time, the escalating conflict in Ukraine adds another layer of uncertainty. Russian forces have attacked Ukrainian infrastructure, while Ukrainian drones targeted critical water facilities in Crimea. These developments are keeping geopolitical tensions elevated, boosting gold’s appeal as a risk hedge.
Moreover, market expectations for rate cuts continue to rise, with one expected in October and a second likely by December. This dovish monetary outlook supports gold, which performs well when real yields decline. Despite Dollar strength, gold’s rally remains firmly intact. This confirms the ongoing uptrend and reflects gold’s ability to hold firm despite evolving economic dynamics.
Gold breaks out of a multi-year channel and enters accelerated uptrend
The gold chart below shows a powerful technical breakout. Since mid-2020, the price has moved within a well-defined ascending channel that guided gold’s multi-year uptrend. This structure provided consistent support and resistance levels, shaping the broader rally. After peaking in 2020, gold entered a prolonged consolidation phase within the channel before finally breaking out.
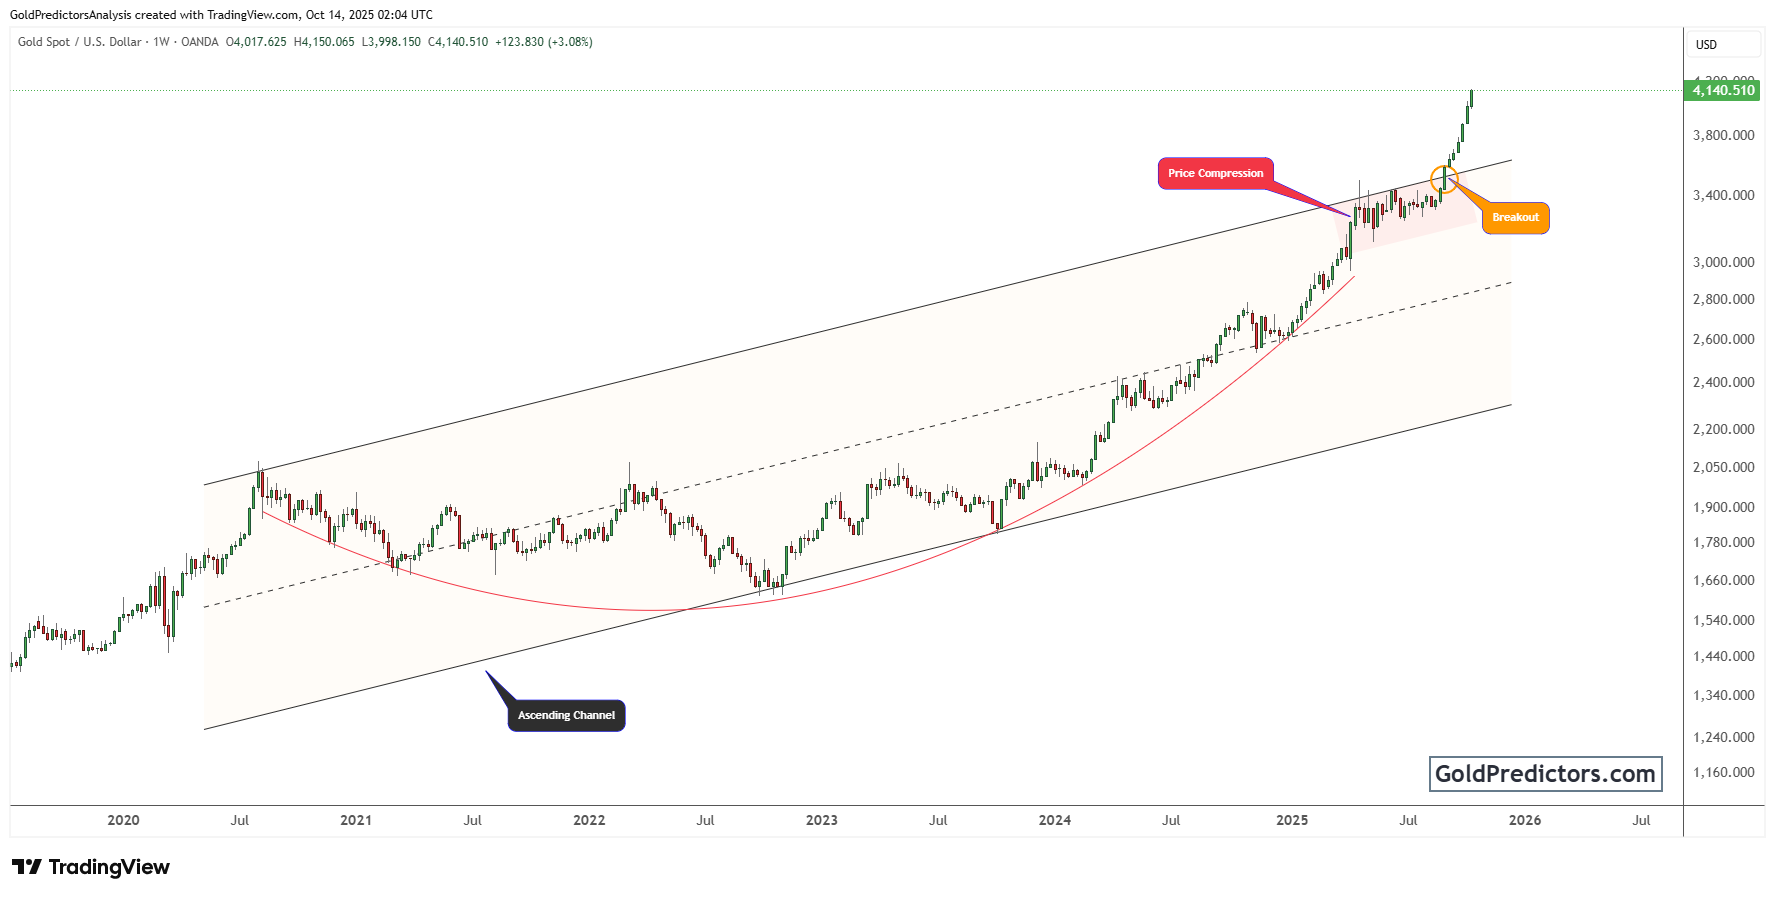
Notably, a clear price compression phase developed ahead of the breakout, signalling growing bullish pressure. The narrowing formation, marked on the chart, reflected this buildup and set the stage for a decisive move. The breakout then occurred near the $3,500 level, sparking a strong surge in momentum. This move carried gold above $4,000 and confirmed the start of a powerful bullish trend.
Moreover, gold has continued to trade firmly above the breakout zone, reinforcing the strength of the move. The curved red line on the chart marks an upward-sloping support that consistently absorbed each pullback. This arc highlights the move from a gradual climb to a more explosive uptrend. As long as price holds above the breakout area, the uptrend is likely to continue, although any sustained move below support could shift momentum.
Gold outlook: Breakout extends as macro risks and Fed bets drive momentum
Gold continues to trend higher, driven by a powerful technical breakout and persistent macroeconomic uncertainty. The metal continues to attract safe-haven demand as political gridlock, trade tensions, and geopolitical conflict intensify. At the same time, rising expectations for Fed rate cuts and declining real yields strengthen the bullish case. With price holding firmly above key breakout levels, the rally shows no signs of exhaustion.
Unlock exclusive gold and silver trading signals and updates that most investors don’t see. Join our free newsletter now!
Unlock exclusive gold and silver trading signals and updates that most investors don’t see. Join our free newsletter now!
Author

Muhammad Umair, PhD
Gold Predictors
Muhammad Umair is a financial markets analyst and investor who focuses on the forex and precious metals markets.


