Gold stocks’ reversal, Silver, and fundamental news

What a beautiful reversal in mining stocks! What a tremendous verification!
Head-and-shoulders pattern verified
I told you that the head-and-shoulders patterns tend to be followed by verifications, and we just saw one.
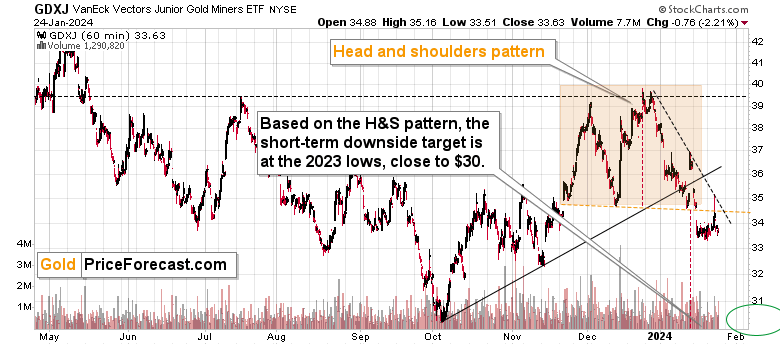
Traditionally, the price should move back to the neck level of the pattern and then move back down. During yesterday’s trading, the GDXJ first moved above the neck level for the pattern, reached its declining dashed resistance line and then it moved back below the neck level as if nothing happened.
I don’t view the formation as invalidated because of that, even though in theory, a move above the neck level is an invalidation. The reason is that the PMI data was released yesterday and we also got an interest rate decision from the Bank of Canada (there was no change in the rates). Data-intensive days can result in volatile price moves of little meaning – some would call it “price noise”.
That’s why in yesterday’s analysis I wrote the following:
Moving back to our current short position in juniors – it’s likely to become MUCH more profitable soon. Even if the GDXJ moves above $34.5 on an intraday basis.
That’s exactly what happened. The head and shoulders pattern was not invalidated – it was verified thanks to the decisive comeback below the neck level. Besides, the GDXJ was trading above it only for about 15 minutes.
It wasn’t only the GDXJ that verified its breakdown yesterday.
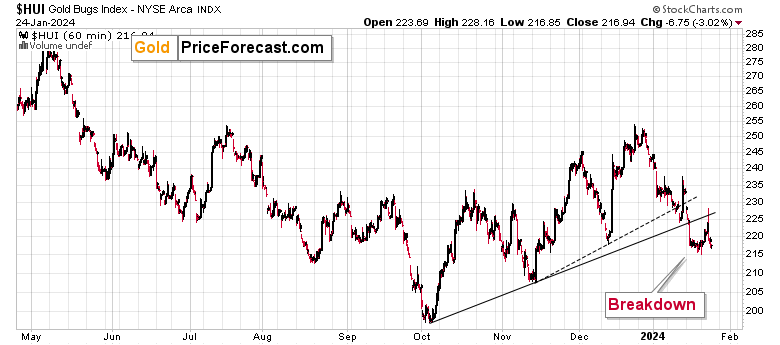
The HUI Index – a proxy for gold stocks – moved back to its previous rising support line and verified it as resistance. It did move slightly above it, but it’s done so after the previous breakdown too – and it fell like a stone in water shortly thereafter – so I view this situation as bearish as well.
Today’s session is also going to be an eventful one, at least as far as fundamental news are concerned. We have the ECB interest rate decision today, U.S. GDP statistics for Q4, and we have initial jobless claims statistics.
This could make one wonder what’s the point of trying to forecast anything based on the charts, if based on fundamental news price can move in either direction.
Let me show you something.
Silver
Silver's volatile journey
Multiple industrial uses, used as money throughout history, used in jewelry, little above-ground stockpiles, inelastic supply and demand… This is all true. It has been true for many years. It certainly has been true throughout 2008.
And yet, here’s silver’s performance in 2008.
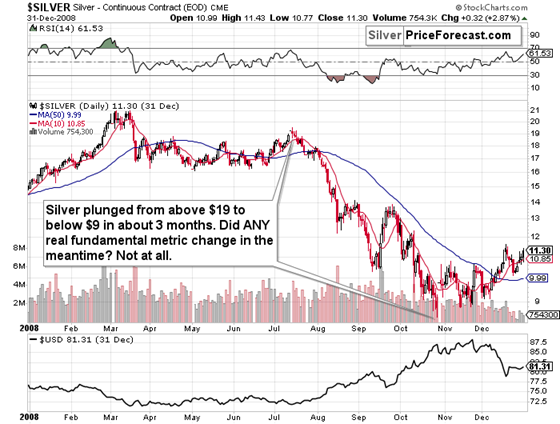
Silver price moved from above $20 to below $10 within a year, even though the above-mentioned fundamental characteristics and long-term potential of this market remained intact.
What does it mean?
It means that if it happened once, it could happen again. We could have no change in the fundamental aspects of the market, and it could slide (or soar) nonetheless.
Now, let me ask you a question. If GPD or initial jobless claims (or even CPI) have readings that are bullish for gold (let’s put aside the discussion about what would be a bullish piece of news here), how much is gold likely to rally based on those statistics? $1? $20? Or maybe $100?
Or if the the same statistics are bearish, how much would gold be likely to fall? $1? $100?
Impossible to tell, because those fundamental news releases don’t determine how far gold would move! Market participants will assess a given statistic in light of the context of what’s going in in general, and then they will react to it through their emotional approach to the market.
-
Bearish emotional approach and bullish data gives us a tiny move higher, or nothing – a pause. And then a slide based on some other news that’s at least mildly bearish or lack thereof.
-
Bearish emotional approach and bearish data gives us a big move lower.
-
Bullish emotional approach and bullish data gives us a big move higher.
-
Bearish emotional approach and bearish data gives us a tiny move lower, or nothing – a pause. And then a rally based on some other news that’s at least mildly bullish or lack thereof.
Given the above, you see that it’s actually assessing the emotional approach of the market that can help you forecast price movements of a given market – not trying to guess what the statistics will be or panicking because you don’t know them before they are released.
Thanks to technical analysis, you can forecast what’s going to happen eventually, regardless of what kind of statistic gets the market to move in a certain direction. And ultimately, it’s this that can help you make great trades and profit.
This is why I’m rarely commenting on fundamentals and why I’m focusing on chart analysis – because it works. Ok, one other thing that really (!) works is focusing on the right ways to trade the market (but I commented on that in great detail yesterday and on Friday) and – most of all – focusing on the right position sizes. If the position size is too big, the odds are going against one.
Since I already mentioned silver price, I want to show you something important that’s happening and that’s most likely about to happen on this market.
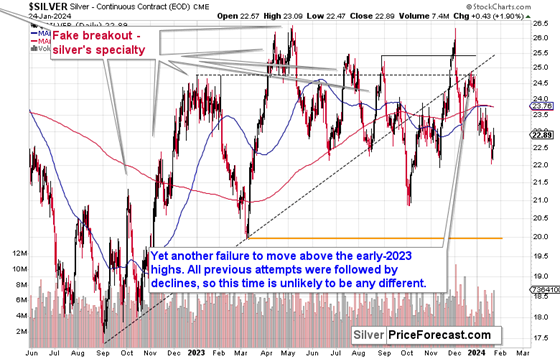
From the short-term point of view, silver has been declining for a few months and it’s been correcting in the meantime. There appears to be nothing special about this week’s move higher.
And yet…
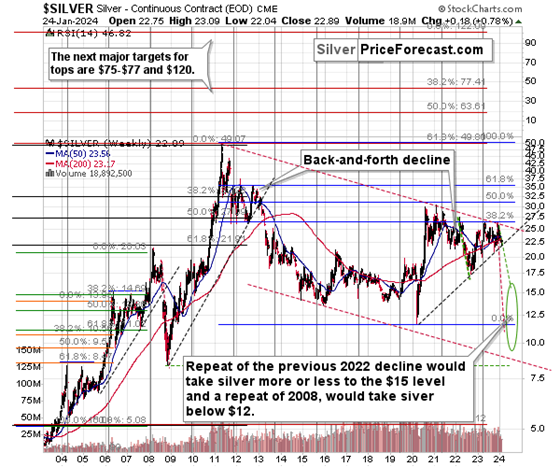
Silver just touched its rising, long-term support line, so it’s no wonder that it corrected.
The really important thing here is that once we see a breakdown here – and it seems that we’re about to – then silver is likely to truly slide in the medium term.
After analogous breakdowns in 2008 and in 2012/2013, silver declined in a very decisive way (and the same happened to mining stocks).
Either way, the outlook is extremely bearish as far as the next several weeks and months are concerned, and it seems that the profits on our short position in junior mining stocks are going to increase shortly.
Want free follow-ups to the above article and details not available to 99%+ investors? Sign up to our free newsletter today!
Want free follow-ups to the above article and details not available to 99%+ investors? Sign up to our free newsletter today!
Author

Przemyslaw Radomski, CFA
Sunshine Profits
Przemyslaw Radomski, CFA (PR) is a precious metals investor and analyst who takes advantage of the emotionality on the markets, and invites you to do the same. His company, Sunshine Profits, publishes analytical software that any


