|

Gold stalls near 2.700 – Is it losing its shine?

  • Gold switches to loses before reaching all-time high.

  • A consolidation phase likely in the short-term.

Chart

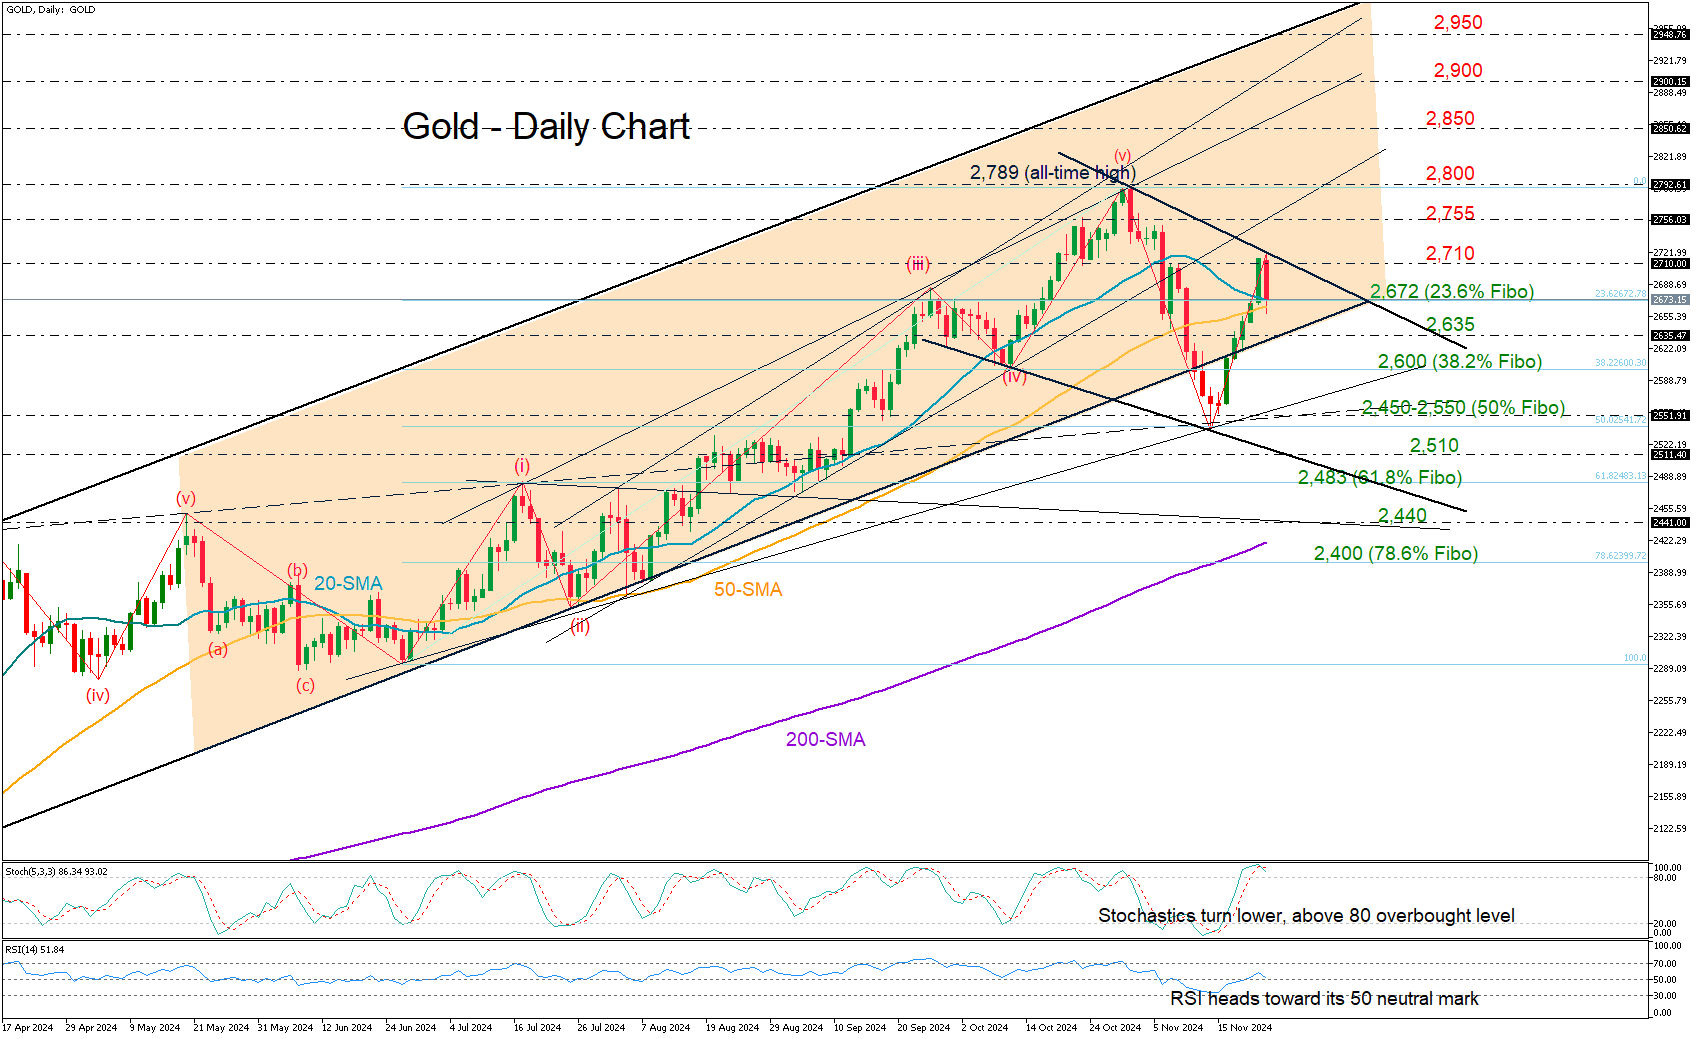
Gold felt Monday's blues, retreating immediately toward its 20-day simple moving average (SMA) at 2,670 after five consecutive winning days.

The pullback in the price is now raising concerns about whether the metal will form a lower high in the coming sessions. With the 20-day and 50-day SMAs nearing a bearish cross, sentiment could stay downbeat, although some key support levels could still come to the rescue.

The 2,672 area, which aligns with the 23.6% Fibonacci retracement and the short-term SMAs, is currently keeping the bears busy. If it breaks, the next level to watch is 2,635, where the lower boundary of the big bullish channel sits. Then the spotlight will fall on the 38.2% (there is an extra space here) Fibonacci at $2,600, a break of which could bring attention to the $2,450-2,550 zone, where the 50% Fibonacci level lies. A drop below $2,510 would signal a bearish trend reversal, likely leading to a decline toward 2,483 or 2,440. 

On the upside, if gold recovers, it could target 2,755, with a break above this level potentially clearing the path to the all-time high of 2,789, and even to 2,800. A further rise could push prices to 2,850 and possibly toward the critical trendline zone of 2,900–2,950.

In summary, gold’s bullish momentum remains at risk. A move above 2,755 would remove downside risks, while a drop below 2,510 could indicate a bearish trend reversal in the short-term picture.

Author

Christina Parthenidou

Christina joined the XM investment research department in May 2017. She holds a master degree in Economics and Business from the Erasmus University Rotterdam with a specialization in International economics.

More from Christina Parthenidou
Share:

Editor's Picks

EUR/USD treads water above 1.1850 amid thin trading

EUR/USD stays defensive but holds 1.1850 amid quiet markets in the European hours on Monday.  The US Dollar is struggling for direction due to thin liquidity conditions as US markets are closed in observance of Presidents' Day. 

GBP/USD flat lines as traders await key UK and US macro data

GBP/USD kicks off a new week on a subdued note and oscillates in a narrow range near 1.365 in Monday's European trading. The mixed fundamental backdrop warrants some caution for aggressive traders as the market focus now shifts to this week's important releases from the UK and the US.

Gold sticks to intraday losses; lacks follow-through

Gold remains depressed through the early European session on Monday, though it has managed to rebound from the daily trough and currently trades around the $5,000 psychological mark. Moreover, a combination of supporting factors warrants some caution for aggressive bearish traders, and before positioning for deeper losses.

Bitcoin, Ethereum and Ripple consolidate within key ranges as selling pressure eases

Bitcoin and Ethereum prices have been trading sideways within key ranges following the massive correction. Meanwhile, XRP recovers slightly, breaking above the key resistance zone. The top three cryptocurrencies hint at a potential short-term recovery, with momentum indicators showing fading bearish signs.

Global inflation watch: Signs of cooling services inflation

Realized inflation landed close to expectations in January, as negative base effects weighed on the annual rates. Remaining sticky inflation is largely explained by services, while tariff-driven goods inflation remains limited even in the US.

Ripple Price Forecast: XRP potential bottom could be in sight

Ripple edges up above the intraday low of $1.35 at the time of writing on Friday amid mixed price actions across the crypto market. The remittance token failed to hold support at $1.40 the previous day, reflecting risk-off sentiment amid a decline in retail and institutional sentiment.