Gold, Silver, USDX: The key April analogies and key factors

It’s this month again. The month when silver topped in 2011, and when the declines accelerated in 2013.
Let’s start today’s article with a quote from Yahoo!Finance:
“According to the latest Bank of America fund managers survey published this week, nearly half of the fund managers surveyed (49%) see long gold, or bets that gold prices will rise, as the most crowded trade in the market right now. This marks the first time in two years that fund managers did not see the Magnificent Seven as Wall Street's most crowded trade, according to the survey.”
Translation: this very likely is a price bubble.
Technically, it looks like the bubble is about to burst, and we would have likely seen the price collapse if it wasn’t for the fresh portion of chaos that we just got. Still, it seems that the U.S. – China situation reached an extreme now (with both countries trying to influence other countries to not to do business with the other), and the next move from here is likely de-escalation. Remember how Trump was handling the situation / negotiations with North Korea many years ago? He moved to extreme tension and then to de-escalation.
The difference this time is that the economic impact from tariffs is going to last.
In other words, thanks to the likely stabilization, gold’s safe-haven appeal will be less important to investors, while the hit on the world economy (with biggest impact being on commodities) is likely to last. This creates a bearish environment for the precious metals sector (in particular for silver which can decline based on both reasons) and commodities.
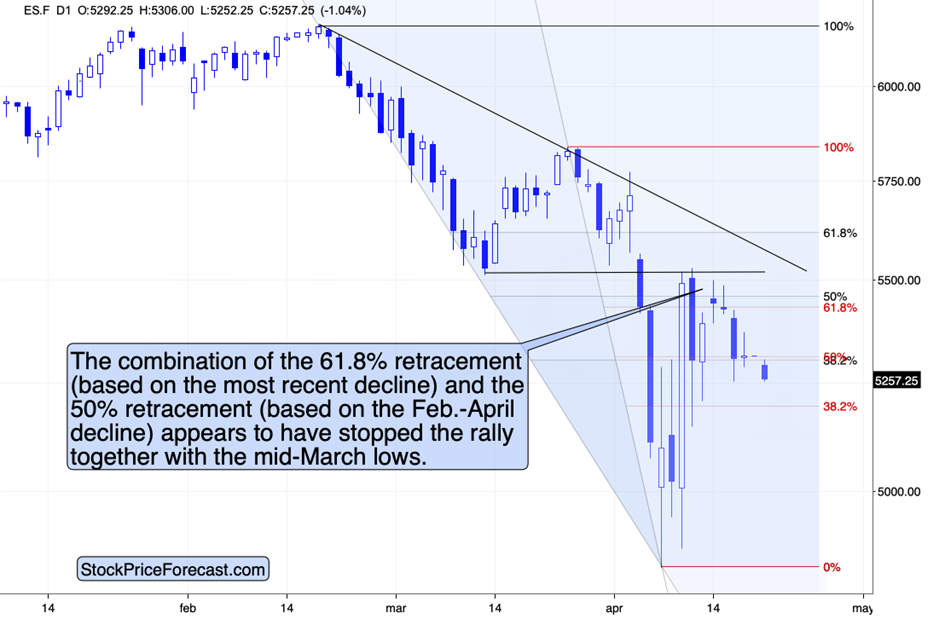
The S&P 500 Index futures are down in today’s pre-market trading. Not significantly yet, but the move toward last week’s lows suggests that the decline will simply continue here.
We saw a sharp corrective rally (on which we profited), and some time passed after initial slide. In other words, we got not one but both things that prepare markets for trend’s continuation. The trend is down, so a decline here was to be expected. Today’s decline might be the first step in another bigger slide.
History repeating? April and Silver’s seasonal memory
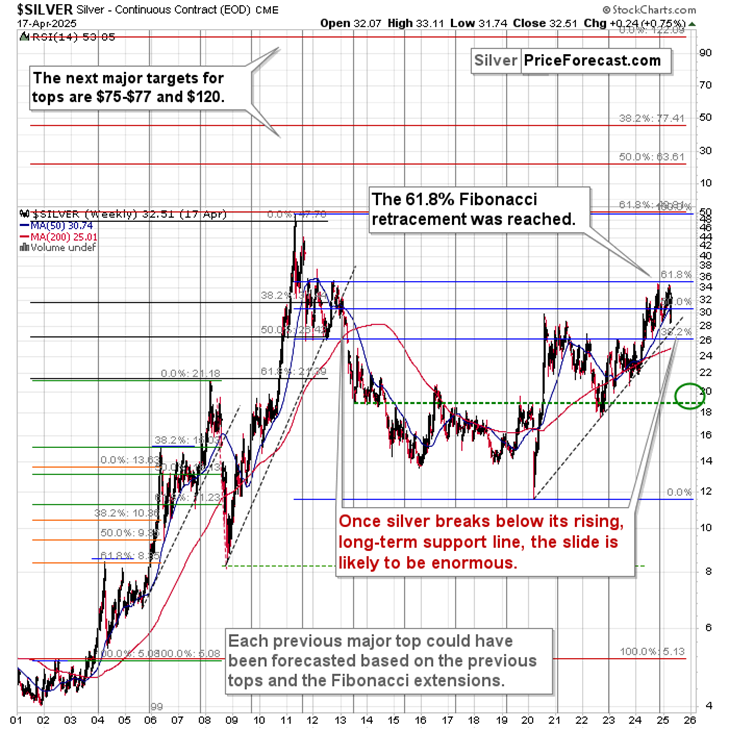
Also, speaking of time, do you remember at which time of the year did silver form its top in 2011? It was in late April.
And do you recall when did the decline in the precious metals and mining stocks accelerate in 2013? It was in mid-April.
While gold soared profoundly, silver moved up just a little. So, what we see now is a gold-only phenomenon, likely very emotional (and thus temporary; vulnerable) upswing.
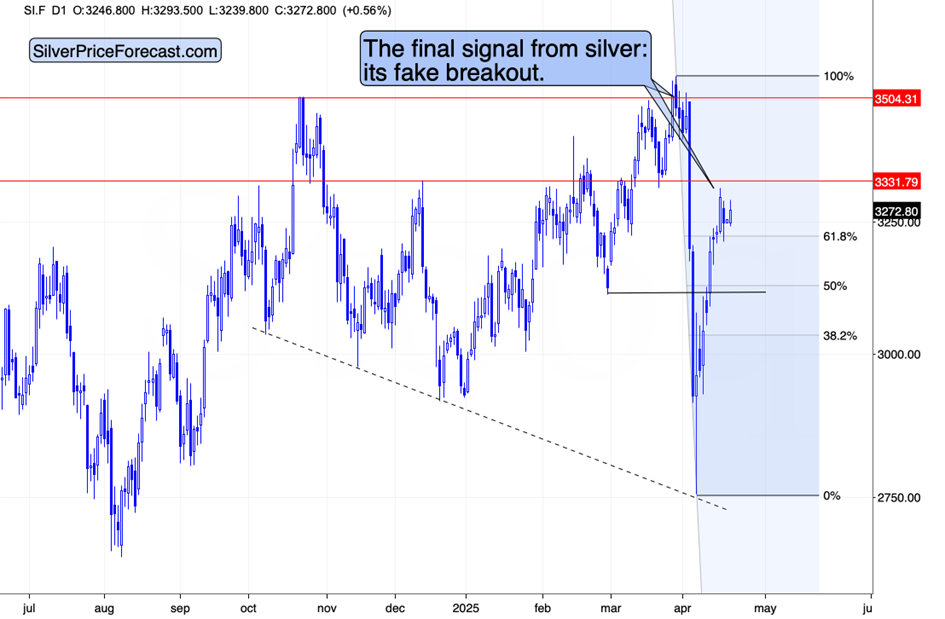
A big slide in silver is the most likely outcome in my view. For anyone waiting on the sidelines with regard to a short position in silver (I mean trading capital; not one’s silver IRA) – today’s weak reaction serves as a confirmation that the short position remains very much justified from the risk to reward point of view, and that the potential for this trade is superb.
My previous comments on silver’s long-term chart remain up-to-date:
“Silver has multiple industrial uses, and if world trade is affected to a significant extent (and this seems like a sure bet now), then silver price is likely to suffer.
Please note that the white precious metal barely moved above its 2020 high in 2024 and 2025 and last year’s high was just a test of the 61.8% Fibonacci retracement level – nothing more. The retracement proved to be a very strong resistance, and despite gold’s strong leadership, silver failed to break higher.
Now it’s leading the way lower, and the best (or worst, depending on how you look at it) is the proximity of the rising, long-term support line. Once this line is broken, the following move could be substantial. This support held for a long time, so breaking it will be a very important technical development.
Moreover, when silver declined from its final top in 2012, it actually declined from the same levels (approximately) at which silver topped last year. It broke below the previous rising support line shortly thereafter, and that’s where the move below $20 started.
Will we see one soon?
Most likely – yes.
And you are prepared.”
USD Index: Triple support speaks bullish
Finally, let’s take a look at what’s going on in the USD Index, as that’s the key background information that will impact… Pretty much everything.
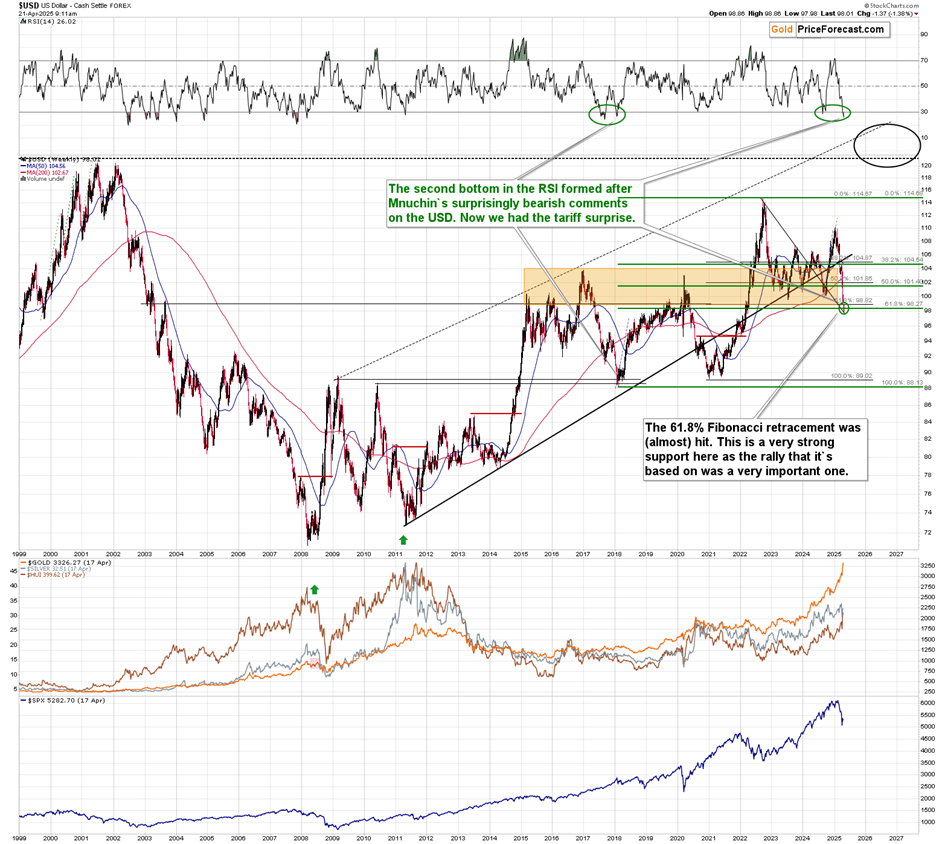
The USDX started this week with a decline, and while this might seem discouraging, I would like to point out three critical facts:
1. This decline took the USDX to the 61.8% Fibonacci retracement based on the 2008 – 2022 rally, which provides VERY strong support. It was only somewhat below the same retracement but based on the 2020 - 2022 rally.
2. The breakdown below the 2020-2022 61.8% Fibonacci retracement was not confirmed.
3. The USD Index just reached its declining resistance line based on the 2022 and 2023 highs.
All three are very strong reasons for the USD Index to turn back up, and the fact that we have them together is truly exceptional (especially that the weekly RSI is now extremely undervalued).
This creates a very bullish outlook for the USD Index, which poses a significant danger to anyone being long precious metals here (from the trading point of view).
Gold could remain volatile (sentiment is still red-hot, people’s searches for gold and silver ira investment near me are still booming), but given silver’s reluctance to move to new highs here, it seems that the white metal is particularly vulnerable to a sell-off.
Want free follow-ups to the above article and details not available to 99%+ investors? Sign up to our free newsletter today!
Want free follow-ups to the above article and details not available to 99%+ investors? Sign up to our free newsletter today!
Author

Przemyslaw Radomski, CFA
Sunshine Profits
Przemyslaw Radomski, CFA (PR) is a precious metals investor and analyst who takes advantage of the emotionality on the markets, and invites you to do the same. His company, Sunshine Profits, publishes analytical software that any


