Gold, Silver and WTI Crude are trapped in longer-term sideways consolidation patterns

XAU/USD
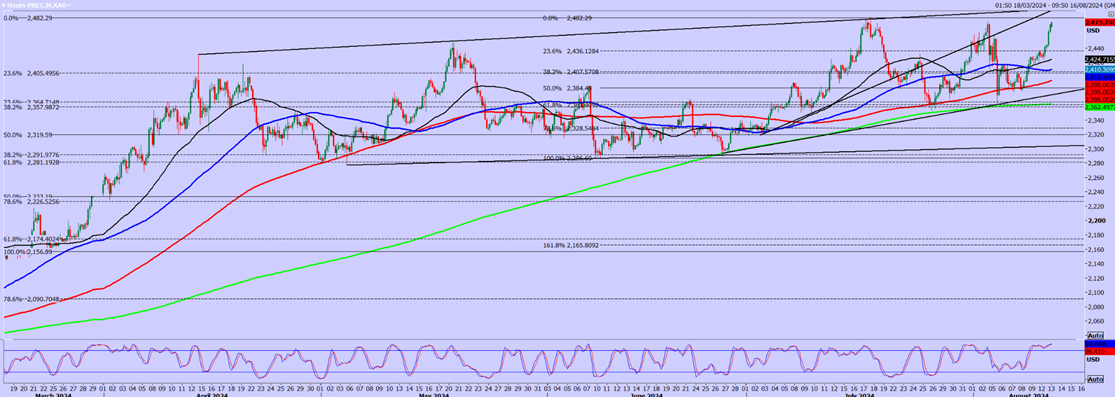
Gold remains stuck in a 4 month sideways channel which makes trade identification difficult. With the release of the inflation number on Wednesday anything could happen today.
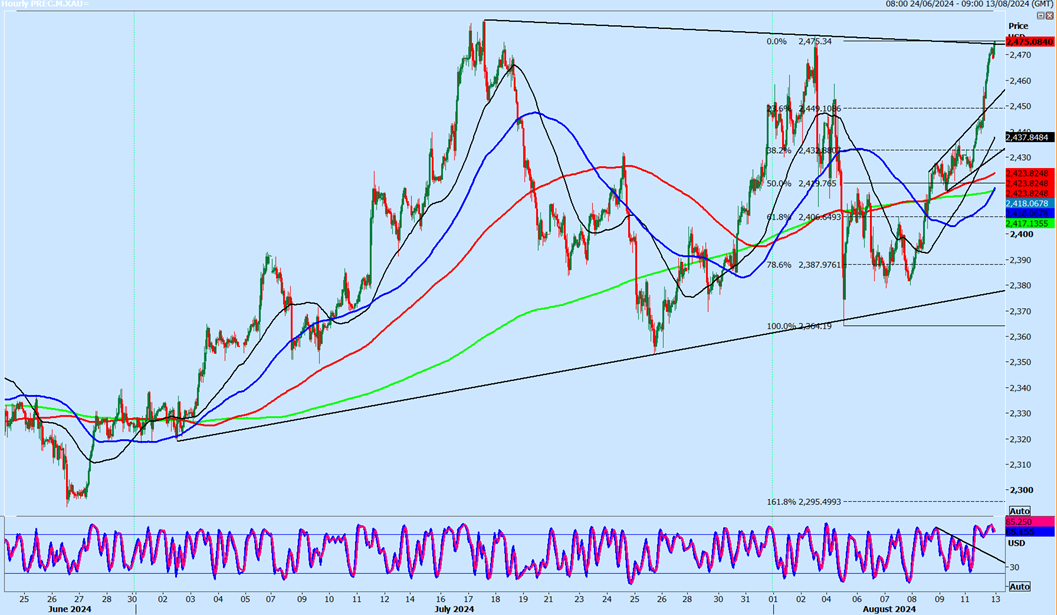
There was some resistance at 2432/36. It held on Friday and again on Monday morning, but there was no profit on offer to short positions so it was of no use!
The break above 2440 was a short term buy signal targeting 2446 & 2450. Eventually we reached the 1 month upper trend line which joins the July & August peaks at 2473/75.
Gold is overbought in the short term so if we hold the trend line, we will remain in a sideways channel, targeting 2463/62 & 2452/50.
If you want to try a short, I would stop above the previous peak at 2477/78. At least the trade has a good risk vs reward.
A break above 2479 tests the July all time high at 2483/84. Obviously bulls need a break above here to signal a potential new leg higher in the longer term 20 year bull trend.
It's almost impossible to identify a decent support level in the ongoing sideways consolidation now. It's not inconceivable that prices drift lower towards the mid range at 2425/20. Below 2415 risks a slide towards the lower trend line of the 4 month pattern at 2385/80.
In a consolidation channel such as this, it is more likely that prices will break higher eventually, because it is expected to be a continuation pattern, not a reversal pattern.
So the longer term bull trend is expected to continue higher eventually, although timing of the breakout above the all time high is impossible to know.
For example the dollar has been in a sideways trend for almost 2 years & has become almost impossible to identify low risk opportunities now. The moves are so random & erratic - no clear pattern to follow. Prices just trade up & down, back & forth over old ground.
Moving averages flat line & converge. Trend lines are no longer reliable.
XAG/USD
Silver has been trending lower to retest the July highs, Unable to hold above the peaks of 2021 & 2022; losing about 20% of it's value since May, so not much of a bull trend really.
However we have bounced a little & unfortunately beaten resistance at 2750/70.
We could now target 2850, if we hold above 2770/60.
However a move back below 2760 risks a slide to 2730 & perhaps as far as the August low at 2660/2641.
WTI Crude September future
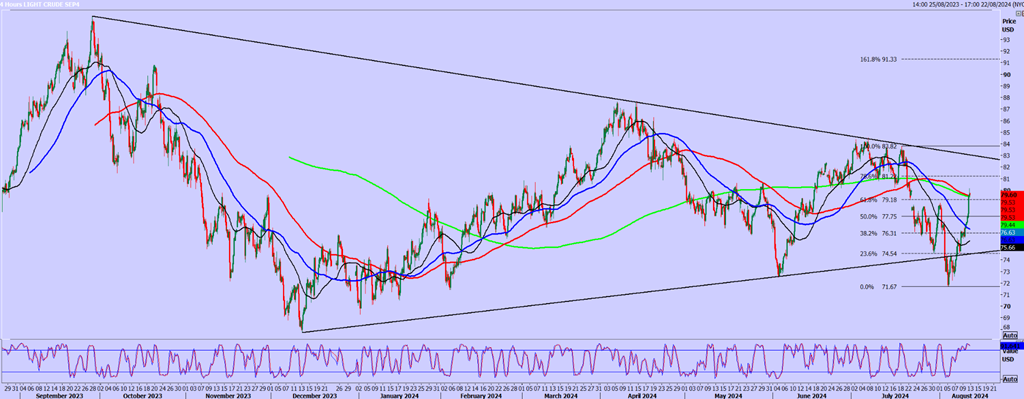
Last session low & high for the September contract: 7670 - 8016.
WTI Crude we wrote: Holding above 7660/7640 on Monday is a buy signal targeting 7750 & 7800/7850 for profit taking on longs.
The 7850 target was hit but Oil continued higher to 8016.
WTI Crude is yet another market caught in a longer term sideways channel, not exactly 2 years old.
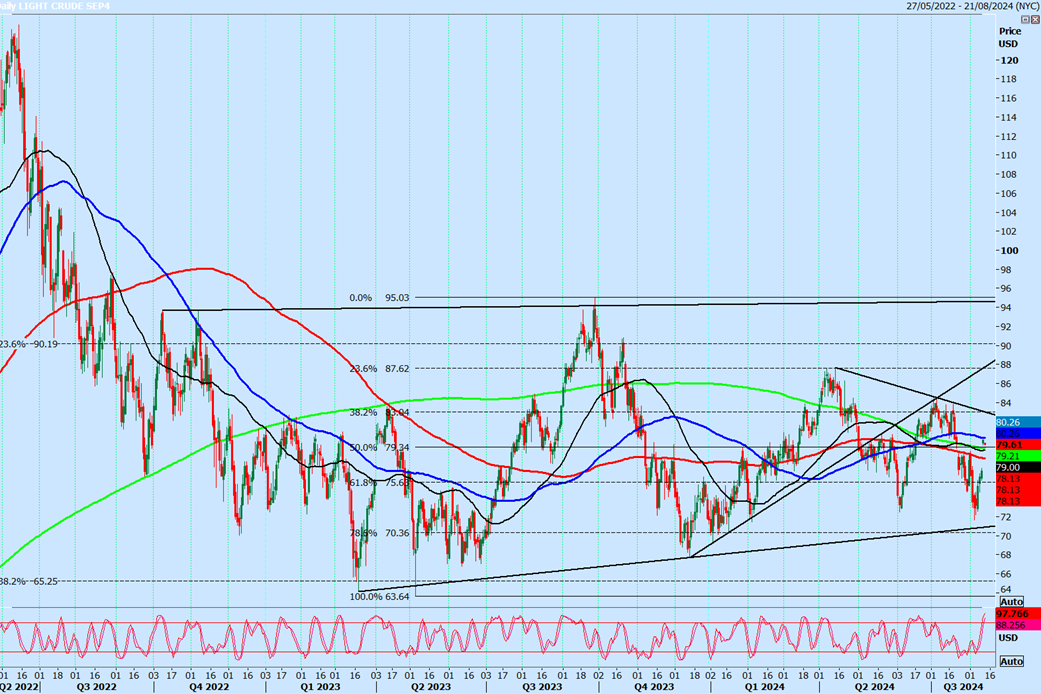
It's particularly difficult to identify opportunities in the middle of the range of course, especially when moving averages have been flatlining & converging for 6 months.
My best guess is that if we hold above 7890/7850 we can continue higher towards 8300.
A break below 7800 however risks a slide to 7660/20.
For the last 11 months WTI Crude has been consolidating in a narrowing triangle pattern as the monthly ranges decrease. The 11-month trend line resistance at 8250/8300 could be tested now.
Author

Jason Sen
DayTradeIdeas.co.uk


