Gold Resists Soaring USD – The Show’s Not Over Yet

The precious metals market didn’t do much yesterday, but – what may seem surprising - that’s quite bullish. It’s bullish, because the USD Index rallied to new yearly highs and this “should have” caused the PMs and miners to decline. It didn’t, which suggests that the decline is not yet ripe for continuation.
In this case, the most likely scenario is that we’ll see another rebound in gold, silver, and mining stocks as soon as the USD Index corrects. Then, PMs could form their final top, and the big decline could begin.
Alternatively, this cycle of back and forth movement could continue a bit longer. Gold could spike, but only if the coronavirus scare gets much worse, as we outlined yesterday. If that happens, silver and miners are not likely to be affected to the same extent as gold – just like what happened in 2014 during the ebola scare.
The above might be confusing so let’s put it in other words, simplifying.
PMs showed resilience yesterday, suggesting that they are likely to rally once USDX corrects.
When the USDX corrects, PMs are likely to rally and silver might outperform gold at that time, as that might be the final part of PMs’ rally.
What may or may not be related to the above is the peak interest in (fear of) the coronavirus. When people get extremely scared of the coronavirus, gold would be likely to rally higher and to outperform silver and mining stocks.
Our plan here is to take profits (…) <trading plan is reserved to subscribers> When we do, it will mean that gold is getting close to its local high.
Ok, so, when could the USD Index correct triggering another move up in the precious metals sector?
USD Index Has Momentum
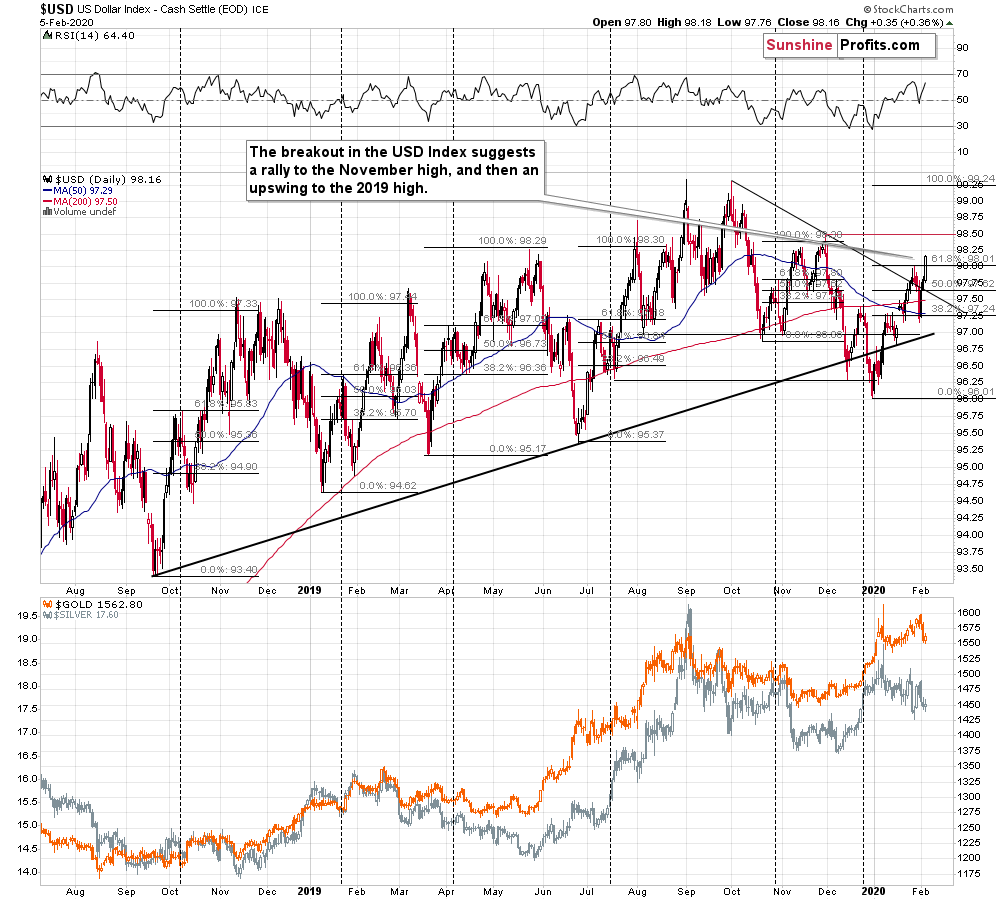
Quite likely relatively soon. The USD Index broke above its declining resistance line and moved to a new yearly high yesterday. The momentum is strong so it could reach its November 2019 high as soon as today.
Now, based on the recent local high (the one that was just broken), we can estimate how high the USD Index is likely to move in the next few weeks. This can be done thanks to the Fibonacci extensions technique. In short, it means multiplying the size of the previous rally by 1.618.
In practice, we can do it by using the Fibonacci retracement tool, but drawing it in a way that anchors the start of the retracement at the initial bottom, and then placing the 61.8% Fibonacci retracement at the initial top. The 100% “retracement” now points to the target. Why would the “retracement” work in this way? Because 100% / 61.8% = 1.618 (approximately) That’s one of the very specific properties of the Phi number. Others include that 1 / 0.618^2 = 2.618 (approximately) and many more.
But the math behind it is not that important – what is important is that it very often works.
In all cases that we marked on the above chart, this technique pointed to important short-term tops. Currently, it points to a top being likely at about 99.24. This is the 2019 high, which makes this level very likely to stop the USD Index… for some time. After all, the USD Index is in a powerful uptrend – it’s likely to exceed its previous highs despite short-term pullbacks.
So why do you mention the November 2019 high, while it is THE 2019 high that’s likely to be reached?
Because the USD Index might not rally to the 2019 high without an intermediate correction. Please note what happened in the cases that we applied the Fibonacci extension to. In all cases, except for the July rally, the USD Index first formed an initial high, corrected, and only then moved to the Fibonacci-extension-based target.
The November high is the next strong (from the short-term point of view) resistance and it’s confirmed also by a short-term inverse head-and-shoulders pattern.
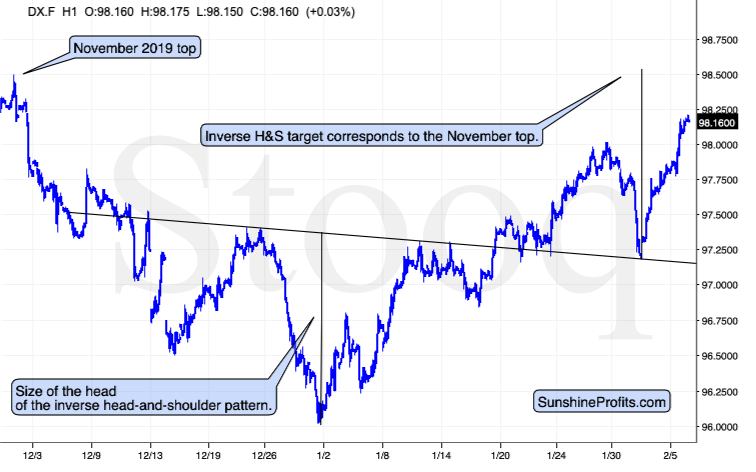
The target is based on the size of the head of the pattern and it quite clearly confirms the target based on the November 2019 high.
Summing up, the USD Index is likely to correct after reaching about 98.5 (the November 2019 high), which is likely to trigger a very short-term upswing in gold and silver. Then the greenback is likely to rally once again and PMs might fall (unless the coronavirus scare peaks, in which case gold could move higher once again for several days).
Want free follow-ups to the above article and details not available to 99%+ investors? Sign up to our free newsletter today!
Want free follow-ups to the above article and details not available to 99%+ investors? Sign up to our free newsletter today!
Author

Przemyslaw Radomski, CFA
Sunshine Profits
Przemyslaw Radomski, CFA (PR) is a precious metals investor and analyst who takes advantage of the emotionality on the markets, and invites you to do the same. His company, Sunshine Profits, publishes analytical software that any


