Gold prices raise to all time high on rate-cut speculation

Despite Fed Chair Powell’s attempts to push back on rate-cut expectations, the market remains firmly convinced that easing will begin next year, leading to a surge in gold to an all-time-high, past the psychological resistance of 2100 before retracing back to around 2070.
Despite Jerome Powell, the Federal Reserve Chief, attempting to push back on rate-cut expectations, the market remains firmly convinced that the U.S. central bank is poised for such actions next year. Investor sentiment reflects this belief, with gold prices briefly reaching an all-time high at $2146 before a swift retracement. Concurrently, U.S. equity markets experienced a rally, reaching their highest level since March 2022. This risk-on sentiment extends to the crypto market, where Bitcoin surpassed the $40,000 mark for the first time since May 2022, driven by optimism surrounding SEC approval for the ETF. In contrast, oil prices faced downward pressure as the OPEC+ meeting encountered internal conflicts, compounded by an increase in oil supplies from non-OPEC countries.
Market movements
Dollar Index
The US Dollar sharply declines after Federal Reserve Chair Jerome Powell adopts a dovish tone on future interest rate decisions, emphasising a more balanced and stabilising approach to inflation. Powell's remarks follow weak November data on the US manufacturing sector, reinforcing the view that Fed rate hikes are moderating economic activity. The Institute for Supply Management's Manufacturing PMI registering at 46.7 for the 13th consecutive month below 50 adds weight to the likelihood of the Fed ending its tightening cycle.
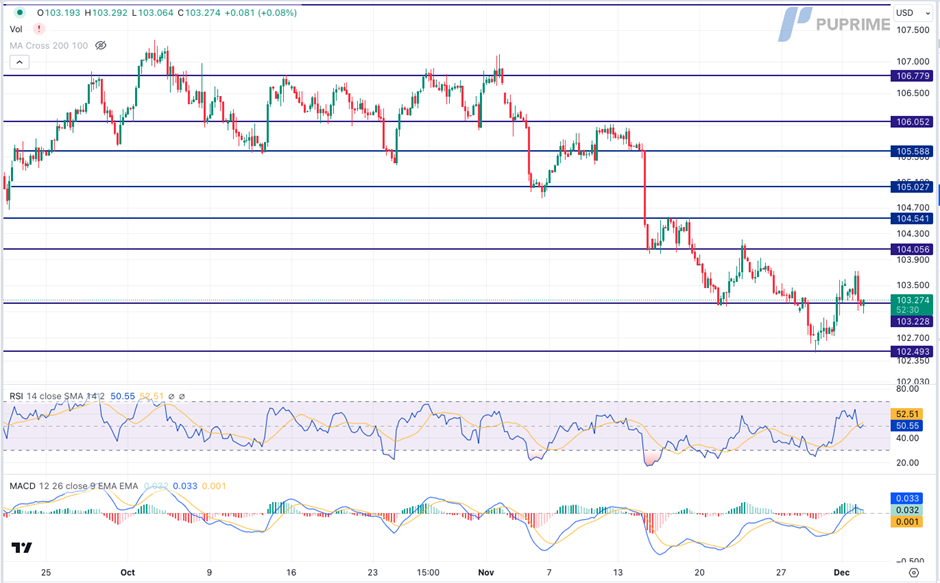
The Dollar Index is trading lower while currently testing the support level. MACD has illustrated diminishing bullish momentum, while RSI is at 50, suggesting the index might extend its losses after breakout since the RSI retreated sharply from overbought territory.
Resistance level: 104.05, 104.55.
Support level: 103.25, 102.50.
XAU/USD
Gold prices surge to an all-time high, breaching the psychological round mark of $2,100 during the early Asian session on Monday. Speculation intensifies that the Federal Reserve has reached the peak of its rate hike cycle, propelling the dollar-denominated gold. Markets, as per the CME FedWatch Tool, now assign over 50% odds of a rate cut in the first quarter of 2024.
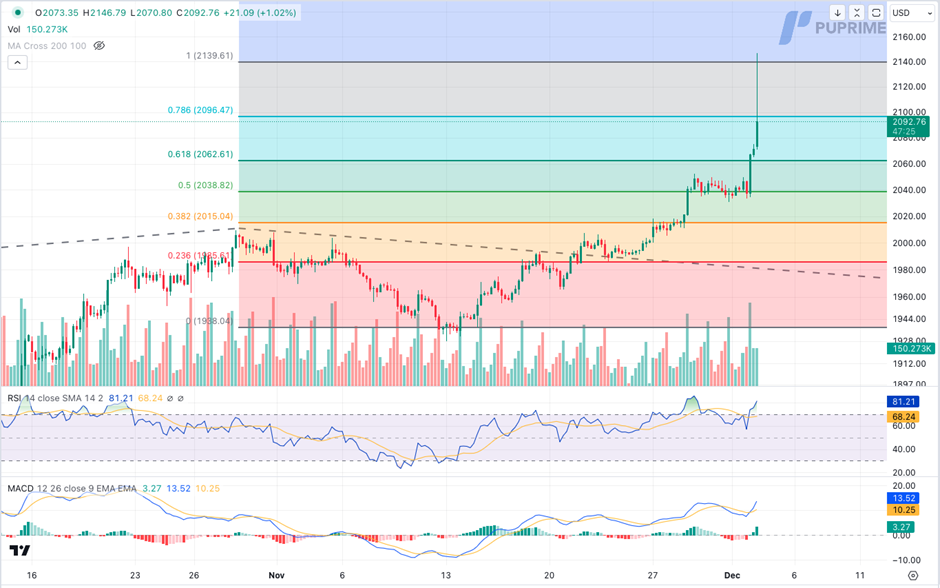
Gold prices are trading higher while currently testing the resistance level. MACD has illustrated increasing bullish momentum. However, RSI is at 81, suggesting the commodity might enter overbought territory.
Resistance level: 2095.00, 2140.00.
Support level: 2060.00, 2040.00.
GBP/USD
The Cable exhibited a seesaw movement near its recent peak, with market sentiment influenced by speculation surrounding a potential Fed rate cut next year. Amidst this speculation, the dollar's index found support below the 103 level, while the Sterling continued to be buoyed by the Hawkish stance maintained by the Bank of England since last week.
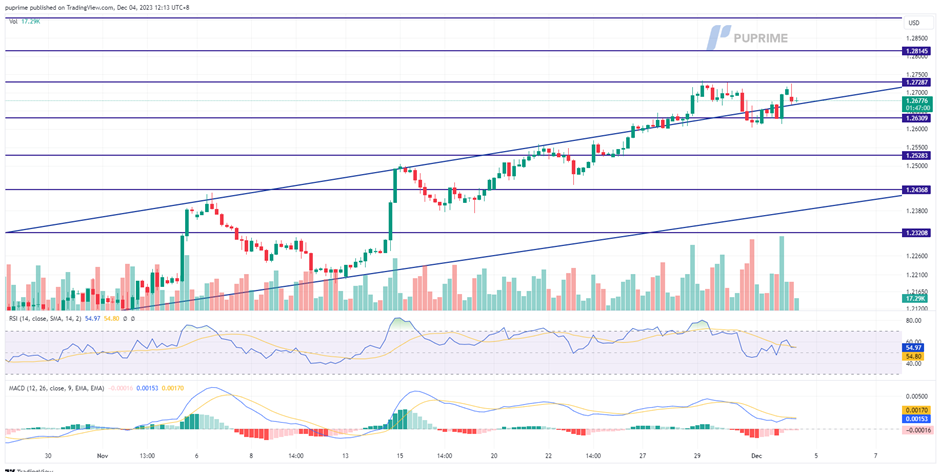
The Cable is consolidating at near its recent peak and is indecisive about its direction. However, the bullish momentum seems to have eased as the RSI has declined from the overbought zone while the MACD is dropping and approaching the zero line from above.
Resistance level: 1.2729 1.2815.
Support level: 1.2630, 1.2528.
AUD/USD
The Australian dollar persists in trading higher against the softened U.S. dollar, fueled by ongoing speculation about potential rate cuts. With the Reserve Bank of Australia (RBA) set to announce its interest rate decision on Tuesday, the currency pair is expected to hold steady in anticipation. Despite the tight job market in Australia, market sentiment leans towards the belief that the RBA will likely maintain its current interest rate level, influenced by global market conditions.
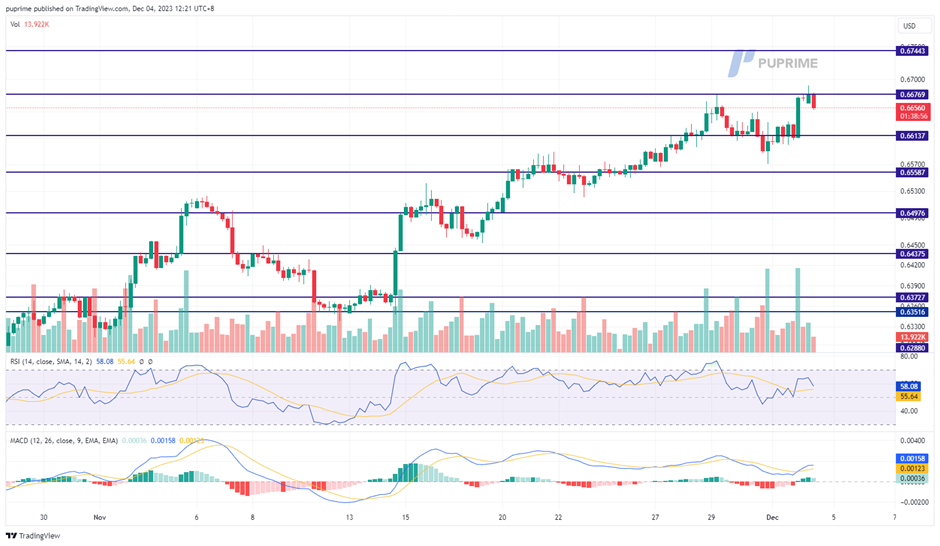
The bullish trend of the AUD/USD pair seems eased and is held below a strong resistance level at 0.6677. The RSI continues to hover at above 50-level while the MACD flows above the zero line, suggesting the bullish momentum is still intact with the pair.
Resistance level: 0.6677, 0.6744.
Support level: 0.6614, 0.6590.
Dow Jones
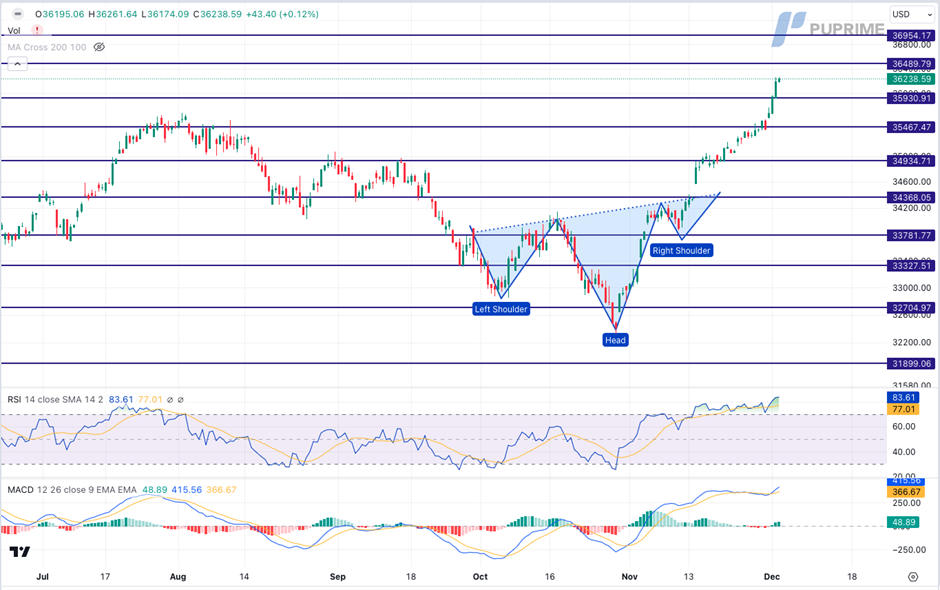
The US equity market maintains a positive trajectory, with the S&P 500 reaching its highest point since March 2022 and accruing nearly 20% in year-to-date gains. The Dow Jones Industrial Average and the Nasdaq Composite also show steady increases, with the former climbing for five consecutive weeks. Investors bet on the Federal Reserve maintaining its current policy stance, anticipating potential rate cuts in the coming year.
The Dow is trading higher following the prior breakout above the resistance level. MACD has illustrated increasing bullish momentum. However, RSI is at 84, suggesting the index might enter overbought territory.
Resistance level: 36490.00, 36955.00.
Support level: 35930.00, 35465.00.
USD/JPY
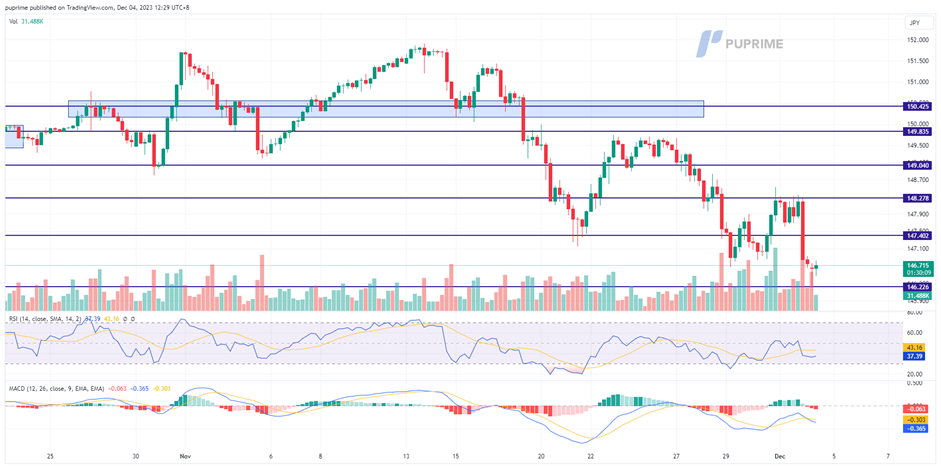
The USD/JPY pair remains under downward pressure as the monetary policy outlooks of both countries continue to diverge. On the one hand, there is a belief in the market that the Bank of Japan (BoJ) might initiate steps to normalise its monetary policy, potentially exiting the decade-long realm of negative interest rates. Conversely, there is an expectation in the market that the Federal Reserve (Fed) may begin to cut rates next year, contributing to the softening of the dollar's strength. This divergence in policy outlooks influences the dynamics of the USD/JPY pair.
The USD/JPY is trading at its lowest level since early September while the bearish trend seems to have persisted. The RSI continues to flow near the oversold zone while the MACD flows below the zero line, suggesting a consistent bearish momentum.
Resistance level: 147.40, 148.30.
Support level: 146.23, 144.78.
BTC/USD
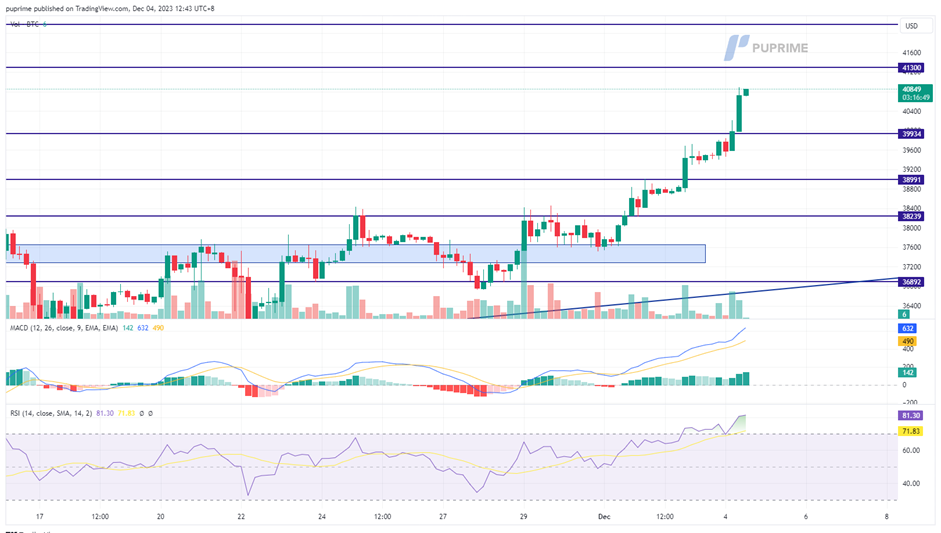
BTC prices exhibited strength, reaching the $40,000 level for the first time since May 2022. This bullish momentum is underpinned by market speculation that the Federal Reserve may initiate rate cuts next year, contributing to an overall heightened risk-on sentiment. Additionally, the anticipation of a BTC ETF approval in the U.S. next year and the approaching BTC halving date serve as robust catalysts propelling the cryptocurrency's upward trajectory.
BTC prices are currently climbing on an extremely bullish momentum. The MACD continue to diverge and move upward while the RSI has strongly broken into the overbought zone, suggesting a strong bullish momentum.
Resistance level: 41300, 42180.
Support level: 39900, 38990.
CL Oil
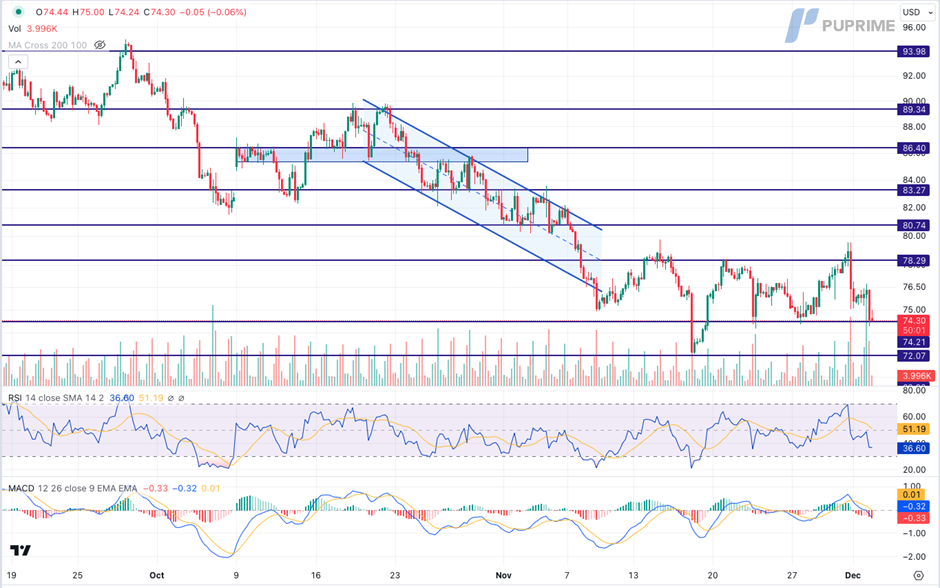
Oil prices retreated while maintaining a consolidative range, reflecting investor scepticism about the effectiveness of OPEC+ supply cuts and concerns regarding a sluggish global economic outlook. Despite OPEC+ producers agreeing to extend oil output cuts, apprehensions persist about the impact of pessimistic growth on oil demand. The lack of a collective revision of OPEC+ production targets, coupled with voluntary cuts, contributes to uncertainties in the oil market.
Oil prices are trading lower following the prior retracement from the resistance level. MACD has illustrated increasing bearish momentum, while RSI is at 43, suggesting the commodity might extend its losses since the RSI stays below the midline.
Resistance level: 78.30, 80.75.
Support level: 74.50, 72.05.
Author

PU Prime team
PU Prime
PU Prime is an award-winning CFD broker offering clients access to multiple products across multiple asset classes. Traders will have access to FX, Commodities, Indices, Share CFDs and Bonds.