Gold prices correct from record highs amid trade optimism and geopolitical shifts

The gold price was corrected from the record level of $3,058 last week. Market sentiment has shifted toward riskier assets, reducing the safe-haven appeal of gold. Several global economic factors contribute to this price action. These include hopes for Chinese economic stimulus, potential tariff adjustments by the US government, and ongoing diplomatic efforts regarding the Ukraine conflict. As a result, gold faces increased selling pressure, leading to a technical breakdown on the price chart. Despite this correction the overall picture remains bullish.
Why Gold prices corrects: Tariffs, China’s economy and geopolitical talks
Gold prices struggle as investors move toward equities and high-risk assets. Optimism over US President Donald Trump’s reciprocal tariff strategies supports this shift. Reports suggest the White House may reduce tariffs set to take effect on April 2. This move could eliminate industry-specific restrictions and focus on reciprocal measures instead. As a result, market sentiment has improved, lowering demand for gold as a safe-haven asset.
China’s economic policies also impact gold prices. The government aims to boost domestic consumption, encouraging investors to take risks. Traders expect more liquidity in Chinese markets, leading them to pull capital away from gold. This shift has contributed to gold’s recent correction.
Geopolitical developments further affect gold prices. Talks between US and Ukrainian Saudi Arabia officials indicate possible progress in the peace deal. Ukrainian Defense Minister Rustem Umerov called these discussions "constructive and meaningful." This optimism has reduced uncertainty, weakening gold’s safe-haven appeal. Investors now watch upcoming US-Russia negotiations on Ukraine, as any breakthroughs could further push gold prices down.
Technical analysis of Gold price
The chart below presents a clear technical setup highlighting the recent bearish trend. A head-and-shoulder pattern formed during the 2-hour timeframe, signaling a potential reversal from previous highs. The breakdown of this pattern indicates a shift in market sentiment, with sellers taking control below the $3,030 neckline.
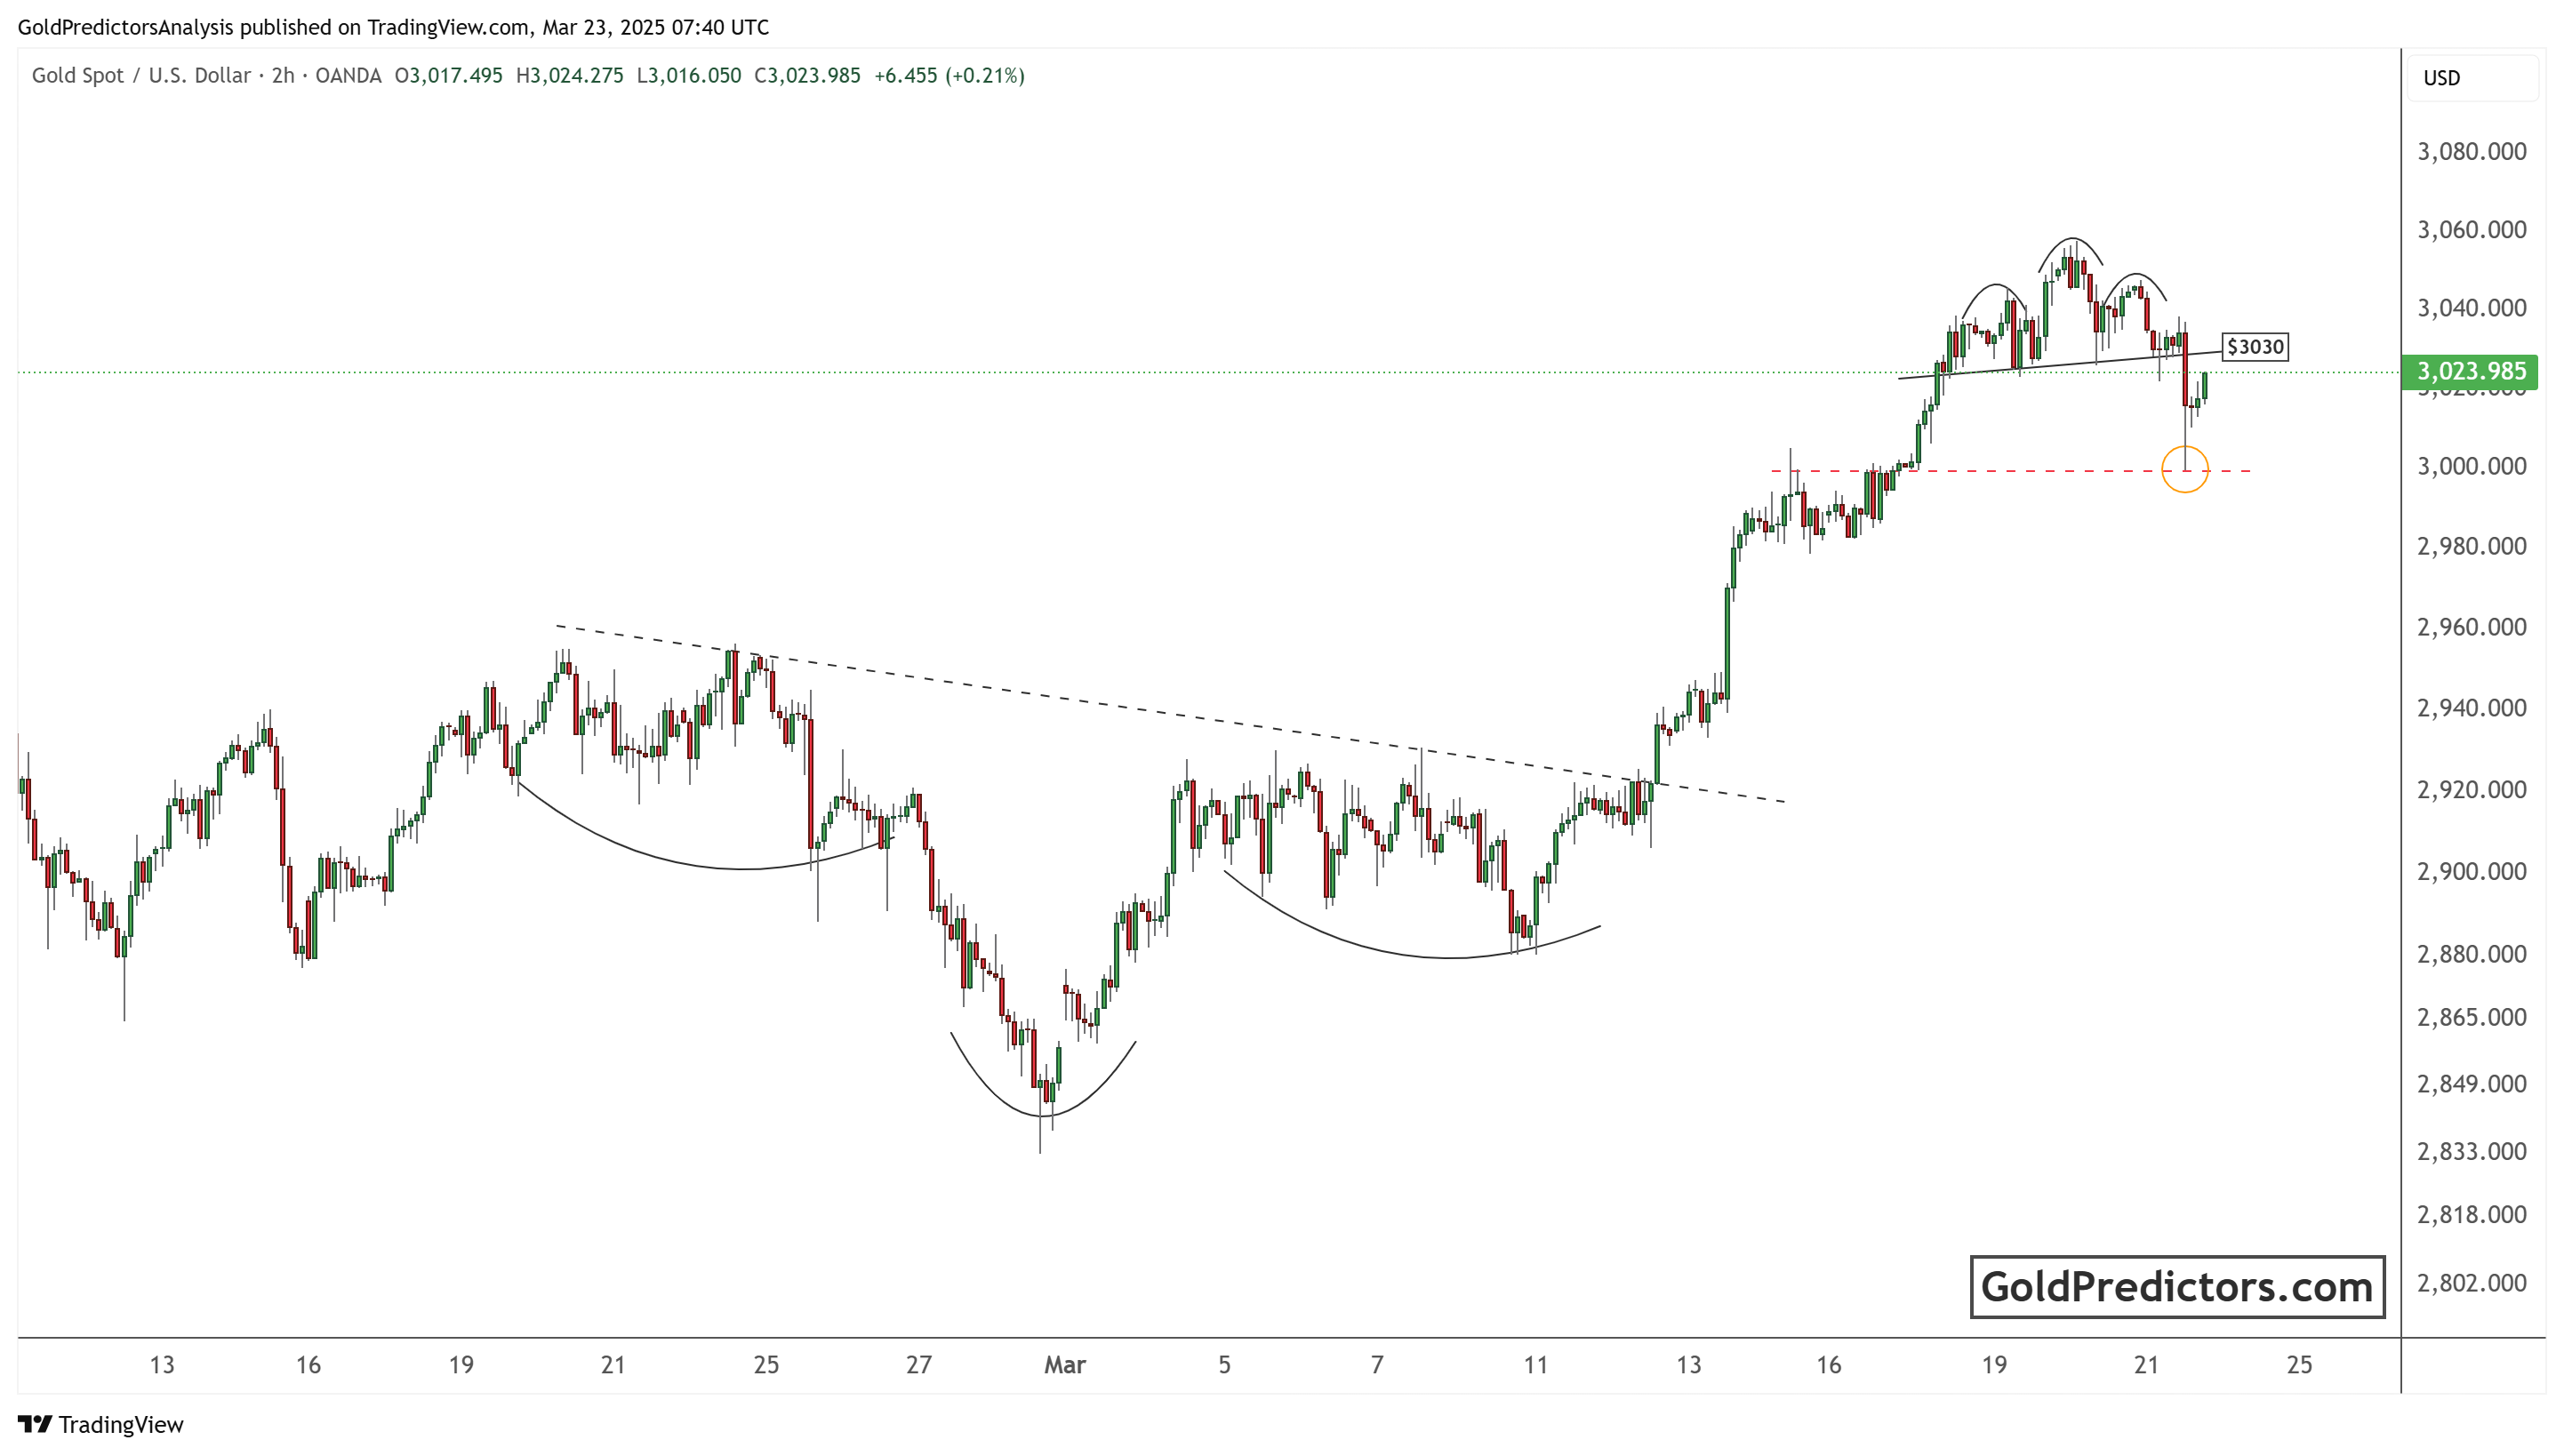
Following the head-and-shoulders breakdown, gold prices dipped toward the $3,000 level, testing a key support area. The red-dotted horizontal line on the chart marks this significant support zone, where buyers attempted to regain control. However, the failed attempt to break above the $3,030 resistance suggests that the bearish trend remains intact.
The broader trend leading up to this formation had been bullish, as indicated by inverted head and shoulders patterns. The breakout from this formation fueled a strong rally, but the recent rejection at $3,058 has now triggered a corrective move. If gold fails to reclaim the $3,030 level in the short term, further downside toward the $2,980 support region remains likely.
Technical indicators support this bearish outlook, with price action struggling to hold above previous support levels. A break below $2,980 could also accelerate selling pressure, bringing $2,950 into focus as the next major downside target. However, a move above $3,058 will keep the bullish trend intact.
Gold trading strategy
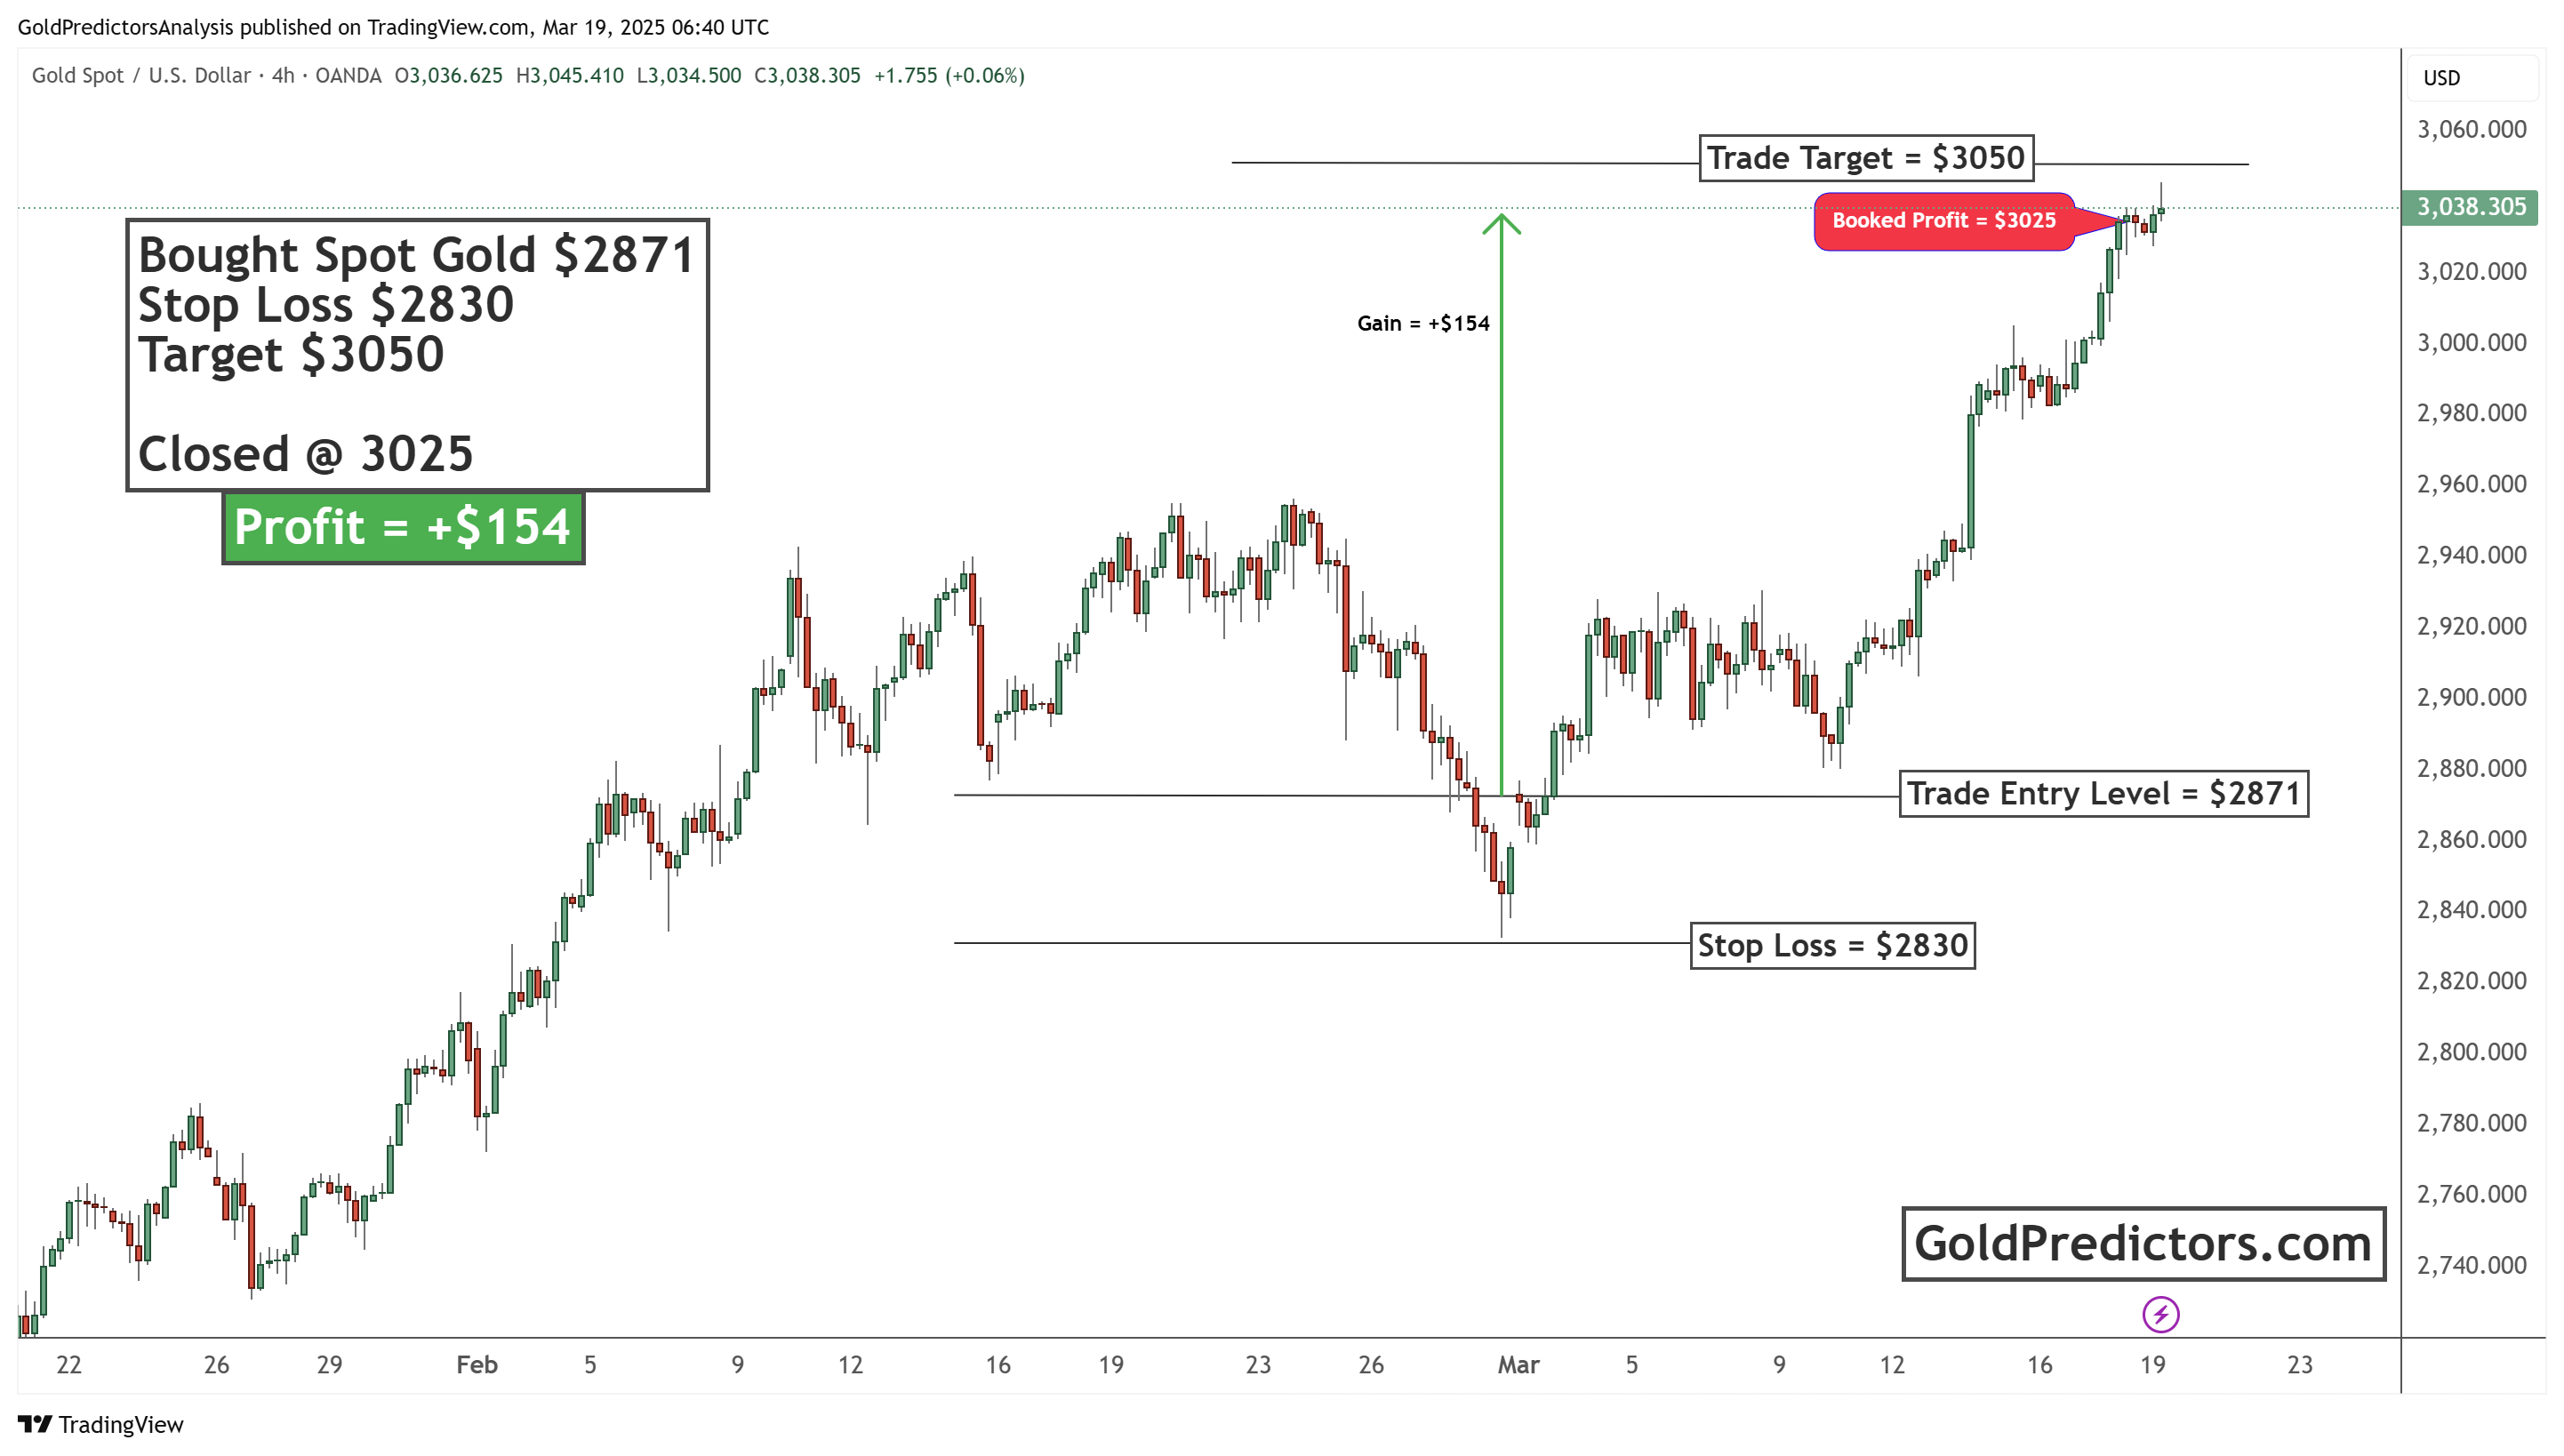
The chart below illustrates a successful gold trade. The trade was entered at $2,871, with a stop loss of $2,830 and a target of $3,050. The position was eventually closed at $3,025, securing a profit of $154 per unit. This setup demonstrates the importance of strategic entry and exit points. Setting a stop loss controls the risk, and taking profit near the target maximizes gains. This trade was sent via WhatsApp to subscribers and resulted in a profitable outcome.
Conclusion
Gold prices are undergoing a corrective phase, weighed down by shifting market sentiment and geopolitical developments. Optimism surrounding trade policies, Chinese economic measures, and Ukraine peace talks have reduced demand for gold as a safe-haven asset. From a technical perspective, the head-and-shoulders breakdown suggests further downside potential, with key levels at $3,030 and $2,980 critical for determining the next move. However, a break above $3,058 will negate the correction mode and keep the bull trend intact. Market participants should closely monitor upcoming market indicators and geopolitical events for further direction on gold price action.
Unlock exclusive gold and silver trading signals and updates that most investors don’t see. Join our free newsletter now!
Unlock exclusive gold and silver trading signals and updates that most investors don’t see. Join our free newsletter now!
Author

Muhammad Umair, PhD
Gold Predictors
Muhammad Umair is a financial markets analyst and investor who focuses on the forex and precious metals markets.


