Gold Price Weekly Forecast: XAU/USD could stretch higher while above $1,950
- Gold price registered weekly gains as US yields turned south.
- XAU/USD's near-term technical outlook points to a bullish tilt.
- Buyers could retain control as long as $1,950 support stays intact.

Gold price completed a bullish breakout this week as US Treasury bond yields declined sharply, with investors reacting to further softening of US inflation. As long as XAU/USD holds above $1,950, technical buyers could remain interested, especially with the Federal Reserve going into the blackout period next week.
What happened last week?
Following the selloff seen after the mixed June jobs report on Friday, the US Dollar (USD) struggled to find demand at the beginning of the new week. In the American session on Monday, the Federal Reserve Bank of New York's monthly Survey of Consumer Expectations showed that consumers' one-year inflation expectation dropped to the lowest level since April 2021 at 3.8% in June from 4.1% in May, causing US yields to edge lower and allowing XAU/USD to end the day in positive territory.
Meanwhile, Manheim announced that the Used Vehicle Value Index from May to June registered its largest one-month decline since the beginning of the coronavirus pandemic. Investors started to price in a weak Consumer Price Index (CPI) reading and the 10-year US T-bond yield dropped below 4% on Tuesday, helping XAU/USD to extend its recovery.
Inflation in the US, as measured by the change in the CPI, declined to 3% on a yearly basis in June from 4% in May, the US Bureau of Labor Statistics (BLS) reported on Wednesday. The Core CPI inflation, which excludes volatile energy and food prices, fell to 4.8% from 5.3%. On a monthly basis, the CPI and the Core CPI both rose 0.2%, less than forecast. The USD came under heavy bearish pressure and the 10-year US yield lost more than 2% after inflation data, as investors started to reassess the Federal Reserve’s interest rate outlook. Consequently, Gold price extended its rally to fresh multi-week highs near $1,960.
On Thursday, the BLS announced that the annual Producer Price Index (PPI) declined to 0.1% in June from 0.9% in May. Wall Street’s main indexes opened sharply higher after soft producer inflation data and the USD selloff continued. Gold, however, struggled to benefit from the persistent USD weakness as XAU/EUR and XAU/GBP turned south, suggesting that the capital outflow out of the USD moved toward Euro and Pound Sterling instead of gold.
According to the CME Group FedWatch Tool, the probability of the Fed raising the policy rate by 25 basis points (bps) in December, in addition to a 25 bps hike in July, declined below 20% after CPI and PPI figures, from 32% earlier in the week.
Ahead of the weekend, the University of Michigan reported that the Consumer Confidence Index improved to 72.6 in early July from 64.4. This reading came in better than the market expectation of 65.5 and helped the USD hold its ground, while limiting XAU/USD's upside.
Next week
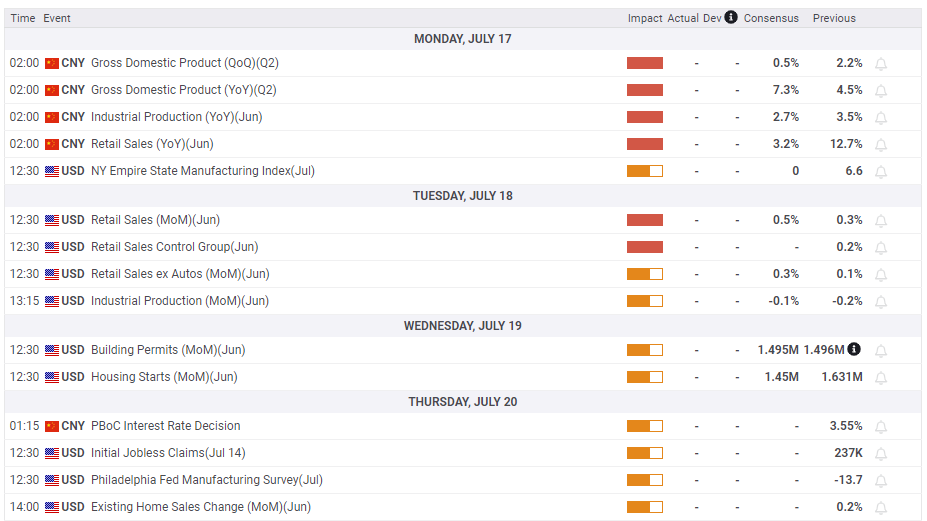
June Retail Sales and second-quarter Gross Domestic Product (GDP) growth data from China will be watched closely by market participants in the early trading hours of the Asian session on Monday. Chinese economy has lost momentum following a strong first quarter that was boosted by the reopening of the economy. The People Bank of China took several actions, including a reduction in the policy rate, to help the economy find its footing. On a quarterly basis, the GDP is forecast to record an expansion of 0.5% in the second quarter, down from 2.2% in the first quarter. A stronger-than-anticipated GDP print from China, world’s biggest consumer of gold, could help XAU/USD stretch higher with investors remaining hopeful for an upbeat demand outlook.
On Tuesday, the US economic docket will feature Retail Sales data for June, which is forecast to show an increase of 0.5% following May’s 0.3% expansion. Although this data is unlikely to alter the market pricing of the Fed’s rate outlook, a strong print could help the USD find demand with the immediate reaction.
Weekly Initial Jobless Claims and Exiting Home Sales data will be featured in the US economic docket on Thursday.
The Fed’s blackout period will start on Saturday, July 15, and policymakers will not be able to speak on monetary policy until the interest rate is announced on July 26. Hence, technical developments could drive XAU/USD’s action next week.
Gold technical outlook
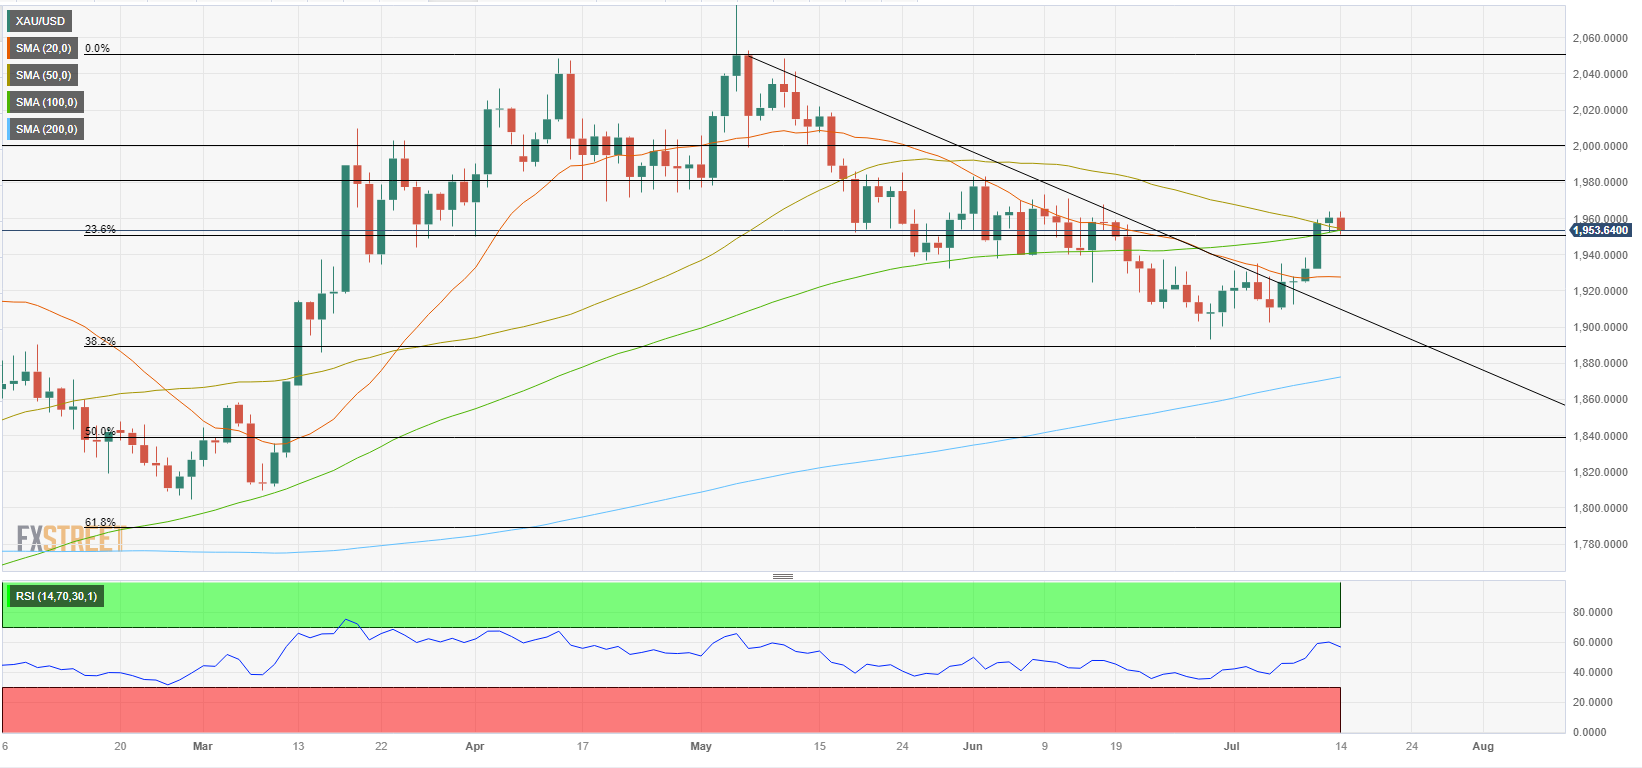
The Relative Strength Index (RSI) indicator on the daily chart rose to its highest level since early May near 60 this week, pointing out to a buildup of bullish momentum. Additionally, XAU/USD broke above the descending trend line coming from early May, confirming the bullish bias.
$1,950/$1,955 area, where the Fibonacci 23.6% retracement of the long-term uptrend, the 50-day Simple Moving Average (SMA) and 100-day SMA, aligns as key technical level for XAU/USD. As long as the pair keeps using that area as support, it could target $1,980 (static level) and $2,000 (static level, psychological level).
In case buyers fail to defend $1,950/$1,955, $1,930 (20-day SMA) could be seen as the next support before $1,910 (broken trend line) and $1,900$1,890 (psychological level, Fibonacci 38.2% retracement).
XAU/USD sentiment poll
According to the FXStreet Forecast Poll, XAU/UD could maintain its recently acquired bullish bias, as the bright metal is seen advancing in the three time-frame under study. With 50% of bulls in the weekly view, the bright metal is seen averaging $1,962 a troy ounce. In the wider perspectives, the number of bullish beats increases, with average targets in the $1,990 region. Is yet to be seen if XAU/USD could surpass the critical $2,000 threshold in a risk-on environment.
The Overview chart offers a mixed picture, although bets favor an advance. The three moving averages present bullish slopes, although the weekly one lags from the current price, somehow limiting the upside. With a few exceptions, the $2000 area seems a natural magnet for the near term.

Premium
You have reached your limit of 3 free articles for this month.
Start your subscription and get access to all our original articles.
Author

Eren Sengezer
FXStreet
As an economist at heart, Eren Sengezer specializes in the assessment of the short-term and long-term impacts of macroeconomic data, central bank policies and political developments on financial assets.


